Previous Story
Technical analysis of NZD/USD for December 22, 2017
Overview:
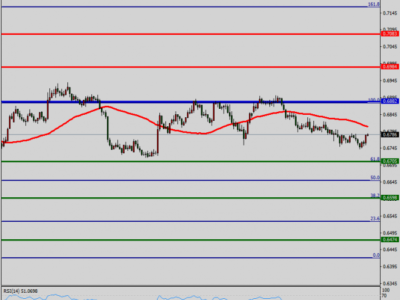
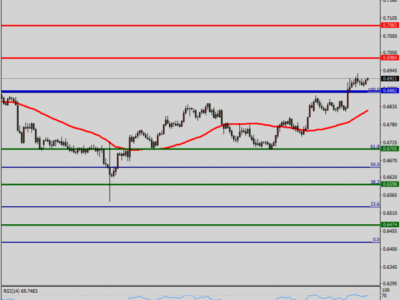
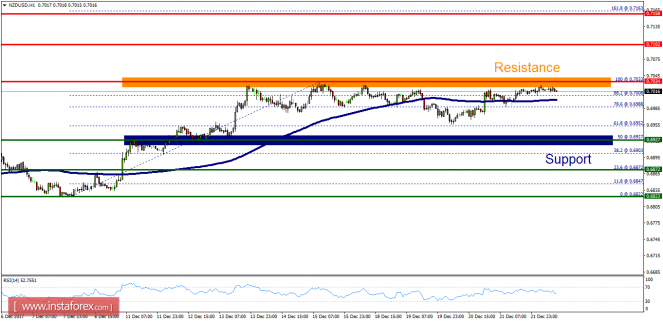
- The Kiwi is still move between the resistance and support of 0.7034 and 0.6927. The trend of NZD/USD pair movement was controversial as it took place in a narrow sideways channel, the market showed signs of instability. Amid the previous events, the price is still moving between the levels of 0.6927 and 0.7034. Besides, the daily resistance and support are seen at the levels of 0.6927 and 0.6872 respectively. Therefore, it is recommended to be cautious while placing orders in this area. So, we need to wait until the sideways channel has completed. Last week, the market moved from its bottom at 0.6927 and continued to rise towards the top of 0.7034. Today, in the one-hour chart, the current rise will remain within a framework of correction.
However, if the pair fails to pass through the level of 0.7034, the market will indicate a bearish opportunity below the strong resistance level of 0.7034 . Since there is nothing new in this market, it is not bullish yet. Sell deals are recommended below the level of 0.7034 with the first target at 0.6927. If the trend breaks the support level of 0.6927, the pair is likely to move downwards continuing the development of a bearish trend to the level 0.6872 in order to test the daily support 2. Tt should be noted that the double bottom is seen at the point of 0.6872.
The material has been provided by InstaForex Company – www.instaforex.com
Source:: Technical analysis of NZD/USD for December 22, 2017