
Previous Story
Technical analysis of NZD/USD for February 21, 2018
Posted On 21 Feb 2018
Comment: 0
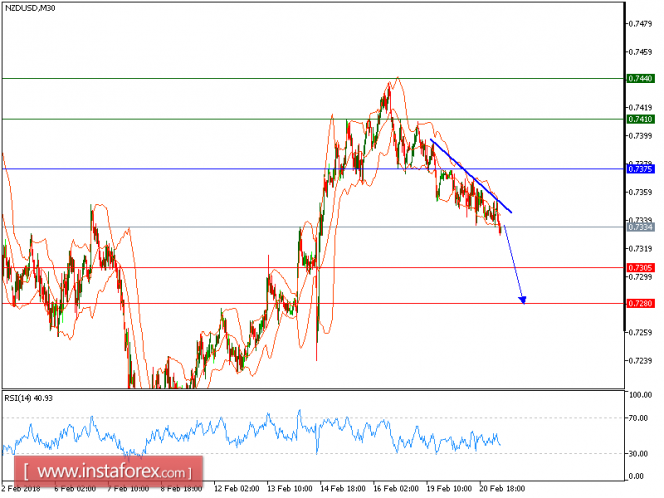
Our first downside target which we predicted in yesterday’s analysis has been hit. NZD/USD is still expected to trade with a bearish outlook. The pair is capped by a bearish trend line since February 16, which confirmed a negative outlook. The downward momentum is further reinforced by both declining 20-period and 50-period moving averages. The relative strength index lacks upward momentum.
To conclude, below 0.7375, look for a new drop with targets at 0.7305 and 0.7280 in extension.
The black line shows the pivot point. Currently, the price is above the pivot point, which is a signal for long positions. If it remains below the pivot point, it will indicate short positions. The red lines show the support levels, while the green line indicates the resistance levels. These levels can be used to enter and exit trades.
Resistance levels: 0.7410, 0.7440, and 0.7485.
Support levels: 0.7335, 0.7295, and 0.7330.
The material has been provided by InstaForex Company – www.instaforex.com
Source:: Technical analysis of NZD/USD for February 21, 2018


