Previous Story
Technical analysis of NZD/USD for January 15, 2018
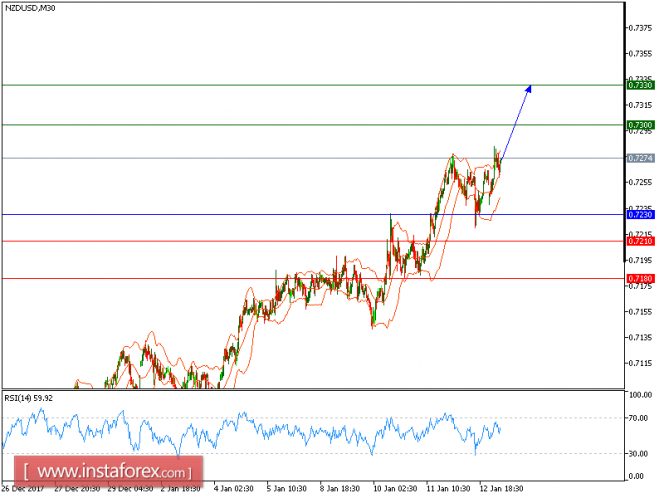
Our first target which we predicted in the previous analysis has been hit. NZD/USD is expected to trade with a bullish outlook. The pair accelerated on the upside, and now remains supported by its rising 20-period and 50-period moving averages. The relative strength index is bullish but has not yet displayed any reversal signal. In which case, as long as 0.7230 is not broken, likely advance to 0.7300 and 0.7330 in extension.
The black line shows the pivot point. Currently, the price is above the pivot point, which is a signal for long positions. If it remains below the pivot point, it will indicate short positions. The red lines are showing the support levels, while the green line is indicating the resistance levels. These levels can be used to enter and exit trades.
Resistance levels: 0.7280, 0.7300, and 0.7330.
Support levels: 0.7210, 0.7180, and 0.7150.
The material has been provided by InstaForex Company – www.instaforex.com