
Previous Story
Technical analysis of Gold for October 12, 2018
Posted On 12 Oct 2018
Comment: 0
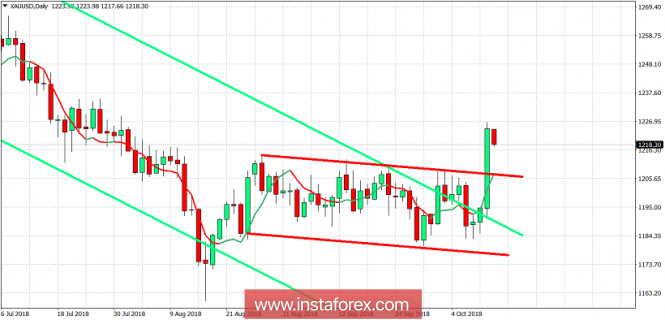
Gold price finally broke out above the trading range its been in for at least a month. This breakout is a bullish sign and we could see prices move higher towards $1,240-60 over the coming weeks.
Red lines – trading range (broken)
Green lines – long-term bearish channel
Gold price has broken above the trading range. Support is now at previous resistance at $1,211. Next support is at $1,184. We could see a pull back towards $1,215-13 but the upside should continue next week. Our first target of $1,220 has been reached. Holding above $1,210 could ope the way for our next target at $1,240-50. Resistance is at yesterday’s highs. Breaking this resistance level will increase the chances of reaching our second target area.
The material has been provided by InstaForex Company – www.instaforex.com


