
Previous Story
Technical analysis of USD/CHF for January 17, 2018
Posted On 17 Jan 2018
Comment: 0
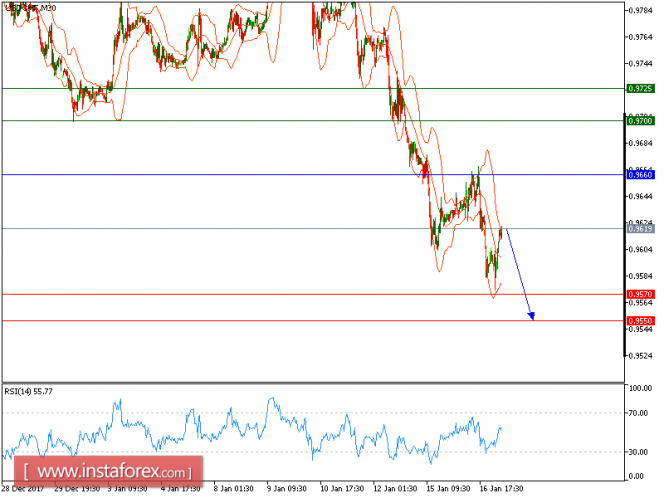
All our downside targets which we predicted in yesterday’s analysis have been hit. The pair extended its losses last night and is heading downward, without showing any reversal signal. The process of lower highs and lows remains intact, which should confirm a negative outlook. In addition, the relative strength index is bearish below its neutrality area at 50.
To conclude, as long as 0.9660 is resistance, likely decline to 0.9570 and 0.9550 in extension.
Chart Explanation: The black line shows the pivot point. The present price above the pivot point indicates a bullish position, and the price below the pivot point indicates a short position. The red lines show the support levels and the green line indicates the resistance levels. These levels can be used to enter and exit trades.
Strategy: Sell, stop loss at 0.9660, take profit at 0.950.
Resistance levels: 0.9700, 0.9725, and 0.9770
Support levels: 0.9570, 0.9550, and 0.9520.
The material has been provided by InstaForex Company – www.instaforex.com


