
Previous Story
Technical analysis of USD/CHF for January 31, 2018
Posted On 31 Jan 2018
Comment: 0
Overview:
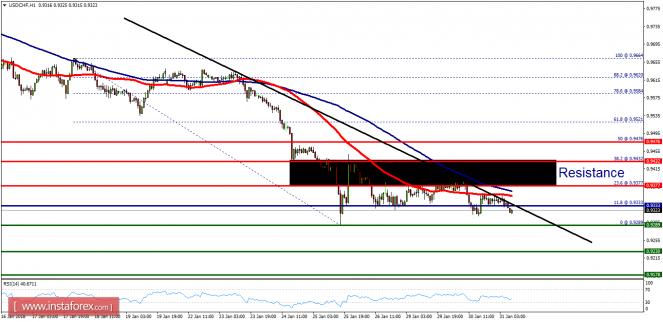
- Pivot point: 0.9333.
- The USD/CHF pair continues to trade downwards from the level of 0.9377 this week. The price of 0.9377 represents the first resistance on the H1 chart. The pair fell from the level of 0.9377 to the bottom around 0.9393. Today, the first resistance level is seen at 0.9377 followed by 0.9432, while daily support is seen at the levels of 0.9289 and 0.9230. According to the previous events, the USD/CHF pair is still trapping between the levels of 0.9377 and 0.9230. Hence, we expect a range of 147 pips in the coming hours. The first resistance stands at 0.6790, for that if the USD/CHF pair fails to break through the resistance level of 0.9377, the market will decline further to 0.9289. This would suggest a bearish market because the RSI indicator is still in a negative area and does not show any trend-reversal signs. The pair is expected to drop lower towards at least 0.9230 in order to test the second support (0.9230). On the contrary, if a breakout takes place at the resistance level of 0.9432 (38.2% Fibonacci retracement), then this scenario may become invalidated.
The material has been provided by InstaForex Company – www.instaforex.com


