
Previous Story
Technical analysis of USD/JPY for December 29, 2017
Posted On 29 Dec 2017
Comment: 0
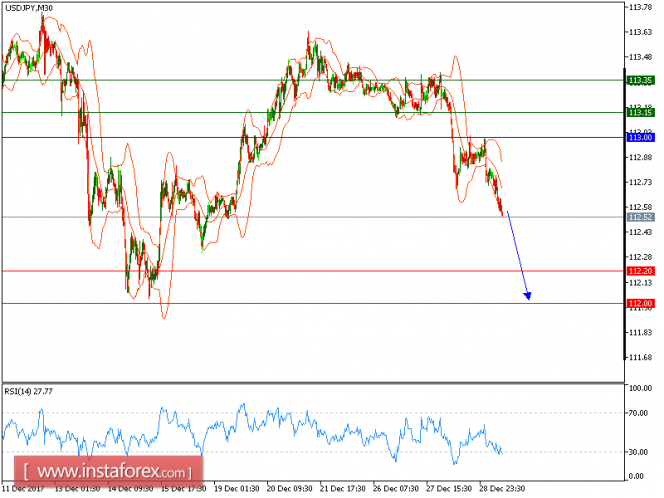
All our downside target which we predicted in yesterday’s analysis have been hit. Despite of recent rebound from 112.65 (the low of December 28), the pair is still capped by a declining 50-period moving average. The relative strength index is below its neutrality level at 50. Even though a continuation of the technical rebound cannot be ruled out, its extent should be limited. To conclude, below 113.00, look for a further decline with targets at 112.20 and 112.00 in extension.
Alternatively, if the price moves in the opposite direction, a long position is recommended above 113.00 with a target of 113.15.
Chart Explanation: The black line shows the pivot point. The current price above the pivot point indicates a bullish position, while the price below the pivot point is a signal for a short position. The red lines show the support levels and the green line indicates the resistance level. These levels can be used to enter and exit trades.
Strategy: SELL, Stop Loss: 113.00, Take Profit: 112.20
Resistance levels: 113.15, 113.35 and 113.85 Support Levels: 112.20, 112.00, 111.70
The material has been provided by InstaForex Company – www.instaforex.com
Source:: Technical analysis of USD/JPY for December 29, 2017


