
Previous Story
Technical analysis of USD/JPY for February 28, 2018
Posted On 28 Feb 2018
Comment: 0
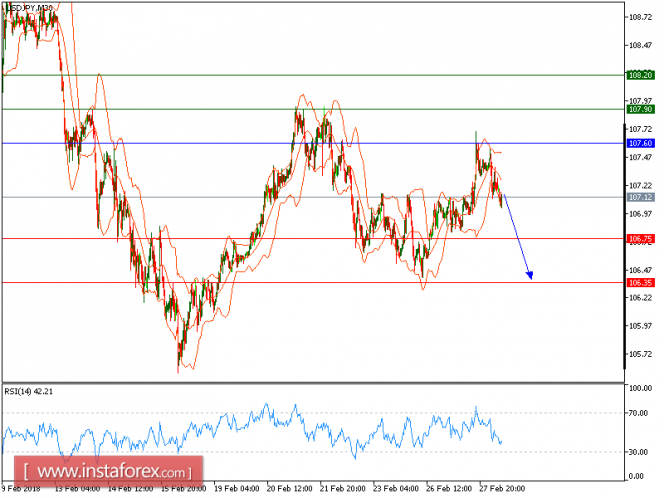
USD/JPY is under pressure. Under pressure. The pair has struck against its nearest key resistance at 107.60, and also remains under pressure below its declining 20-period and 50-period moving averages. The relative strength index is below its neutrality area at 50, and calls for a new drop. Last but not least, the process of lower highs and lows remains intact, which should confirm a bearish outlook, and call for a further decline to 106.75 and 106.35 in extension.
Alternatively, if the price moves in the opposite direction, a long position is recommended to be above 107.60 with a target of 107.90.
Chart Explanation: The black line shows the pivot point. The current price above the pivot point indicates a bullish position, while the price below the pivot point is a signal for a short position. The red lines show the support levels, and the green line indicates the resistance level. These levels can be used to enter and exit trades.
Strategy: SELL, stop loss at 107.60, take profit at 106.75.
Resistance levels: 107.90, 108.20, and 108.50
Support levels: 106.75, 106.35, and 106.
The material has been provided by InstaForex Company – www.instaforex.com
Source:: Technical analysis of USD/JPY for February 28, 2018


