
Previous Story
Technical analysis of USD/CHF for August 29, 2017
Posted On 29 Aug 2017
Comment: 0
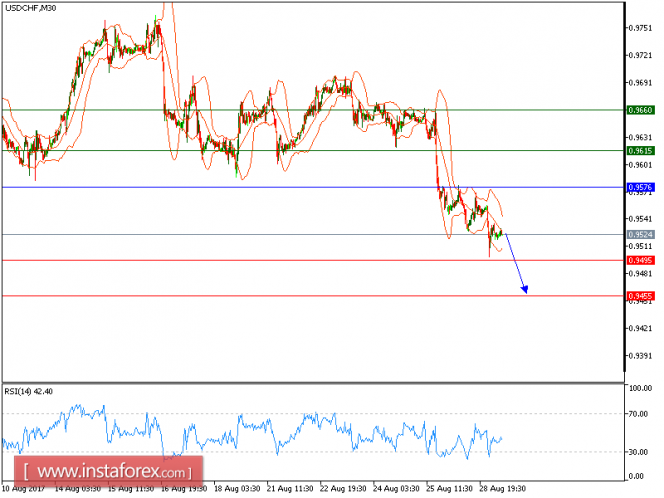
USD/CHF is expected to trade in a lower range as the pair is under pressure. Despite a recent rebound from 0.9575, the pair is trading below its declining 20-period and 50-period moving averages. The upside potential should be limited by the key resistance at 0.9575. Even though a continuation of the technical rebound cannot be ruled out, its extent should be limited.
Therefore, as long as 0.9575 is not surpassed, look for a further decline to 0.9495 and even to 0.9455 in extension.
Chart Explanation: The black line shows the pivot point. The present price above the pivot point indicates the bullish position, and the price below the pivot points indicates the short position. The red lines show the support levels and the green line indicates the resistance levels. These levels can be used to enter and exit trades.
Strategy: SELL, Stop Loss: 0.9575, Take Profit: 0.9495
Resistance levels: 0.9615, 0.9660, and 0.9700
Support levels: 0.9495, 0.9455, and 0.9415
The material has been provided by InstaForex Company – www.instaforex.com


