
Previous Story
Technical analysis of USD/CHF for May 19, 2017
Posted On 19 May 2017
Comment: 0
Overview:
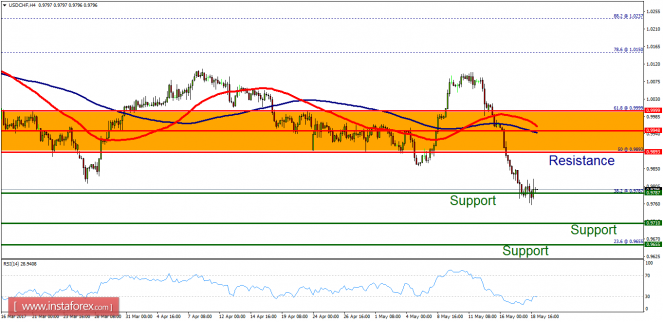
- In the long term, the USD/CHF pair continues to move downwards from the level of 0.9893.
The major resistance level is seen at 0.9850 followed by 0.9893 as second resistance.
Also, the level of 0.9787 represents a weekly pivot point for that it will act as major level in coming hours.
Amid the previous events, the pair is still in a downtrend, because it is trading in a bearish trend from the new resistance line of 0.9893 towards the first support level at 0.9787 in order to test it. - If the pair succeeds to pass through the level of 0.9787, the market will indicate a bearish opportunity below the levels of 0.9710 and 0.9655.
However, if a breakout happens at the resistance level of 0.9893 (resistance 1), then this scenario may be invalidated.
Additionally, the support is found at 0.9893, which represents the 50% Fibonacci retracement level on the daily time frame. Since the trend is below the 50% Fibonacci level, the market is still in an downtrend.
The material has been provided by InstaForex Company – www.instaforex.com


