
Previous Story
Technical analysis of USD/CHF for September 08, 2017
Posted On 08 Sep 2017
Comment: 0
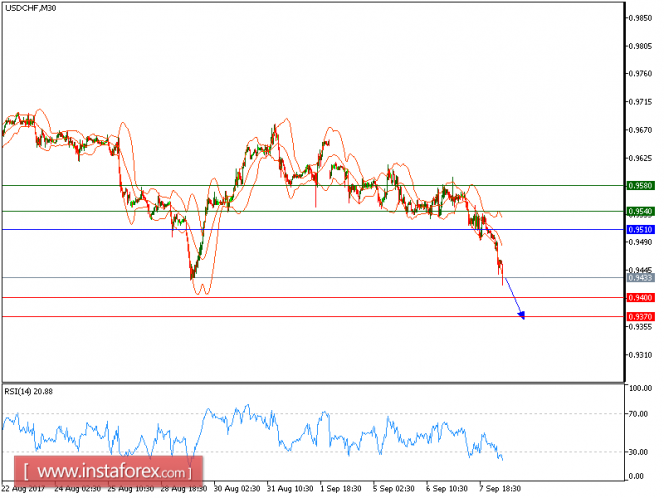
USD/CHF is under pressure and capped by a negative trend line. The pair is capped by a declining trend line since September 1, which confirms a bearish outlook. Both declining 20-period and 50-period moving averages play resistance roles. The relative strength index lacks upward momentum.
To sum up, below 0.9510, look for a further drop to 0.9400 and even to 0.9370 in extension.
Chart Explanation: The black line shows the pivot point. The present price above the pivot point indicates the bullish position, and the price below the pivot points indicates the short position. The red lines show the support levels and the green line indicates the resistance levels. These levels can be used to enter and exit trades.
Strategy: SELL, Stop Loss: 0.9510, Take Profit: 0.9400
Resistance levels: 0.9540, 0.9580, and 0.9625
Support levels: 0.9400, 0.9370, and 0.9335
The material has been provided by InstaForex Company – www.instaforex.com
Source:: Technical analysis of USD/CHF for September 08, 2017


