
Previous Story
Technical analysis of USD/JPY for August 18, 2017
Posted On 18 Aug 2017
Comment: 0
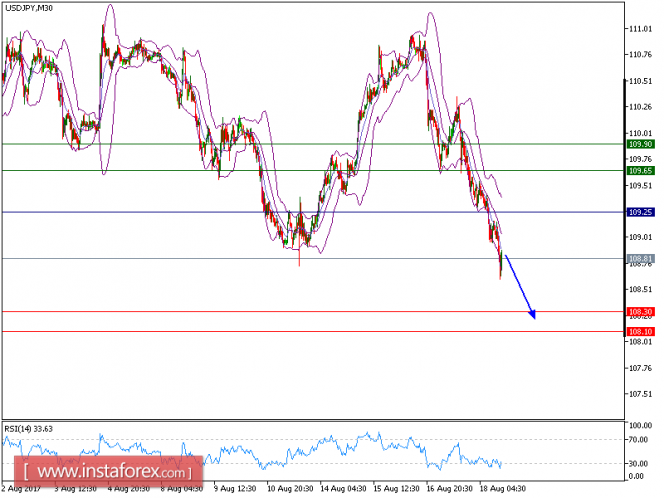
USD/JPY is under pressure and expected to trade with bearish outlook. The pair remains in consolidation, and the nearest resistance at 109.25 maintains the strong selling pressure on the prices. Furthermore, the relative strength index is mixed to bearish below its neutrality area at 50.
To sum up, as long as 109.14 holds on the upside, look for a return to 108.30. A break below 108.30 would trigger a new drop towards 108.10.
Alternatively, if the price moves in the opposite direction, a long position is recommended above 109.25 with a target at 109.65.
Chart Explanation: The black line shows the pivot point. The current price above the pivot point indicates a bullish position, while the price below the pivot point is a signal for a short position. The red lines show the support levels and the green line indicates the resistance level. These levels can be used to enter and exit trades.
Strategy: BUY, Stop Loss: 109.25, Take Profit: 1
Resistance levels: 109.65, 109.90, and 110.25
Support Levels: 108.30, 108.10, 107.50
The material has been provided by InstaForex Company – www.instaforex.com


