
Previous Story
Technical analysis of USD/JPY for July 21, 2017
Posted On 21 Jul 2017
Comment: 0
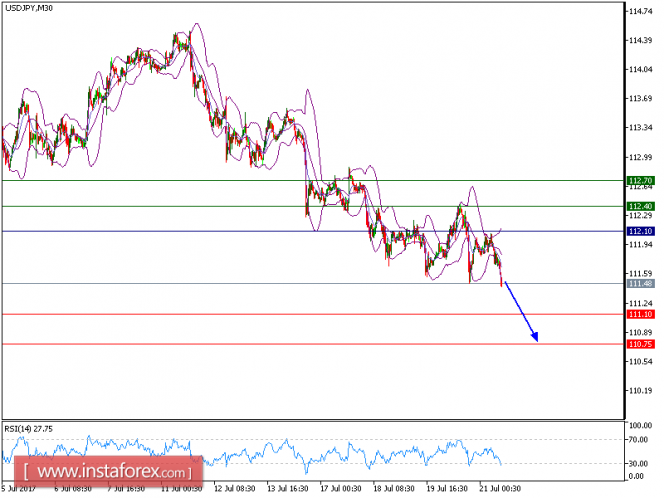
USD/JPY is under pressure and expected to trade in a lower range. Although the pair posted a rebound from 111.50 (lows of July 19 and 20), the upward potential is likely to be limited by the resistance at 112.10. The relative strength index is mixed with a bearish bias.
Therefore, as long as 112.10 is not surpassed, look for a return to 111.10. A break below this level would trigger a new drop to 110.75.
Alternatively, if the price moves in the opposite direction than predicted, a long position is recommended above 112.10 with a target at 112.40.
Chart Explanation: The black line shows the pivot point. The current price above the pivot point indicates a bullish position while the price below the pivot point is a sign for a short position. The red lines show the support levels and the green line indicates the resistance level. These levels can be used to enter and exit trades.
Strategy: SELL, Stop Loss: 112.55, Take Profit: 111.50
Resistance levels: 112.40, 112.70, and 113.15 Support Levels: 111.10, 110.75, 110.50
The material has been provided by InstaForex Company – www.instaforex.com


