
Previous Story
Tuesday 29th July: Daily Technical Outlook and Review.
Posted On 29 Jul 2014
Comment: 0
For the readers’ benefit:
Price action confirmation: Simply means traders will likely wait for price action to confirm a level by consuming an opposing supply or demand area, then entering a trade on a possible retracement, this may occur on the lower timeframes also.
Pending orders: means pending orders are likely seen.
EUR/USD:
4hr TF.
The higher-timeframe picture resembles the following:
- Weekly timeframe: Price is now firmly trading within weekly demand at 1.32940-1.34847.
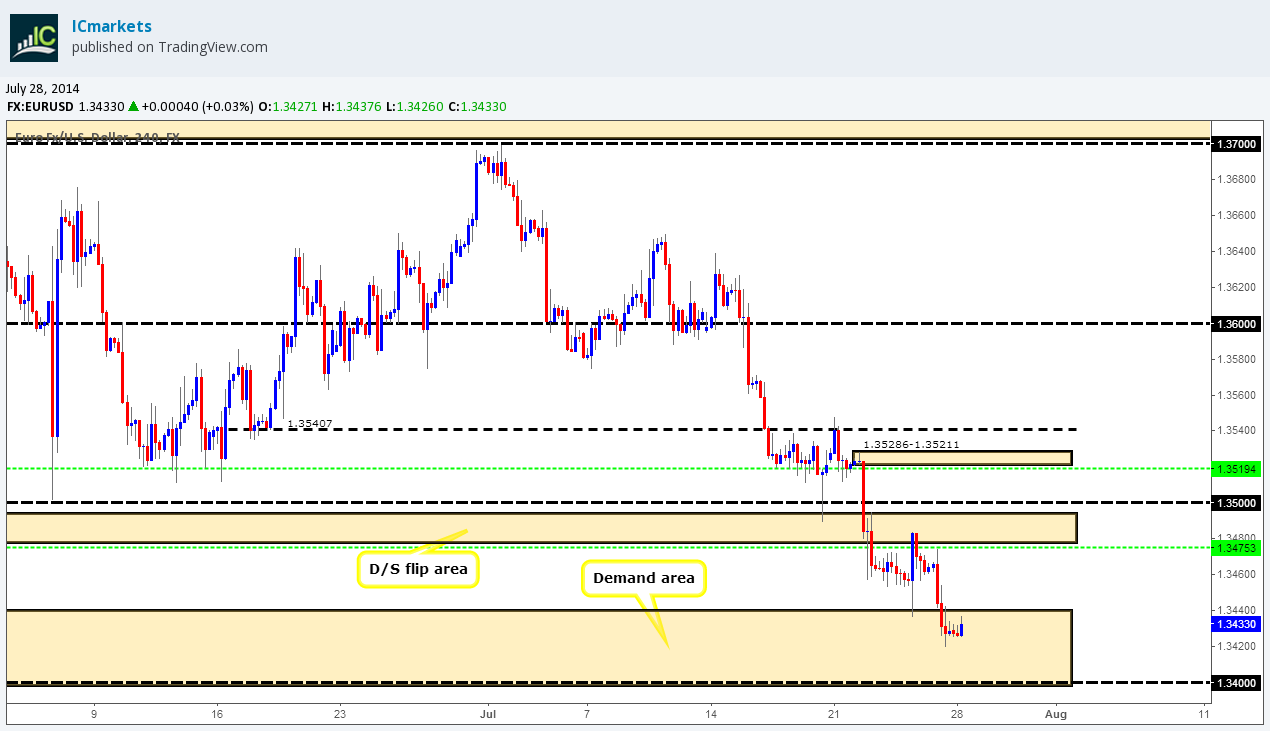
- Daily timeframe: The daily demand area at 1.33984-1.34397 is now active and being tested. Price is now capped between the aforementioned daily demand area and the D/S flip area above at 1.34760-1.35265. If we see a break south of the aforementioned daily demand area, prices may be forced to test our daily area of interest below at 1.33559.
Technically, recent price action has not moved much. The market opened at 1.34295 and still remains trading within 4hr demand at 1.33984-1.34404, buyers and sellers at the time of writing appear indecisive regarding possible direction.
We wrote an in-depth analysis on this pair in the weekly forecast, and most of what was written there still holds very true, so this may serve as a valuable reminder for any traders considering trading this pair in the near-term future:
Granted we are in higher-timeframe demand (Weekly: 1.32940-1.34847 Daily: 1.33984-1.34397), but it appears at the time of writing the buyers are showing very little interest. On the 4hr timeframe, if we see a break below the 4hr demand area at 1.33984-1.34404 and the round number 1.34, price could drop, and drop hard. Take a look to the far left under the aforementioned 4hr demand area, we see consumed demand, the spikes down were no doubt sent to consume buyers on the initial rally north, and this means the path south is now very likely clear.
The only area we can see that has likely fresh buy orders waiting is around 4hr demand below at 1.31037-1.31278. Remember our higher-timeframe analysis? This small 4hr demand area is located in a whopping weekly demand area at 1.31037-1.32262 and also within daily demand at 1.31037-1.31755, so please do note this 4hr demand area down, as we may see a huge bullish reaction from here sometime soon.
Pending/P.A confirmation orders:
- No pending buy orders (Green line) are seen in the current market environment.
- No P.A confirmation buy orders (Red line) are seen in the current market environment.
- Pending sell orders (Green line) are seen just below a decision-point area (1.35286-1.35211) at 1.35194, as we believe this area to be good for a bounce at the very least, notice how this was the area pro money sellers likely made the decision to break the round number 1.35000, meaning there may very well be unfilled sell orders still there.
- Pending sell orders (Green line) are seen just below the D/S flip area (1.34760-1.34943) at 1.34753.The reasoning behind setting a pending sell order here was because this is the area we believe on this timeframe pro money sellers made the decision to push prices south into 4hr demand at 1.33984-1.34404, meaning there may well be unfilled sell orders still lurking there.
- No P.A confirmation sell orders (Red line) are seen in the current market environment.
Quick Recap:
Much the same as the last analysis, If a break is seen of the 4hr demand area at 1.33984-1.34404 (where price is currently trading at), this could be the first signs of a big decline in the market to around 4hr demand below at 1.31037-1.31278. Price is currently capped between the aforementioned 4hr demand area and the 4hr D/S flip area above at 1.34760-1.34943.
- Areas to watch for buy orders: P.O: No pending buy orders are seen in the current market environment. P.A.C: No P.A confirmation buy orders are seen in the current market environment
- Areas to watch for sell orders: P.O: 1.35194 (SL: 1.35319 TP: Dependent on price action approach) 1.34753 (SL: 1.35031 TP: Dependent on price approach). P.A.C: No P.A confirmation sell orders are seen in the current market environment.
GBP/USD:
4hr TF.
The higher-timeframe picture resembles the following:
- Weekly timeframe: The sellers have begun to show some serious interest within weekly supply at 1.76297-1.67702, could we see a touch of weekly demand below at 1.66917-1.67939 in the next few weeks?
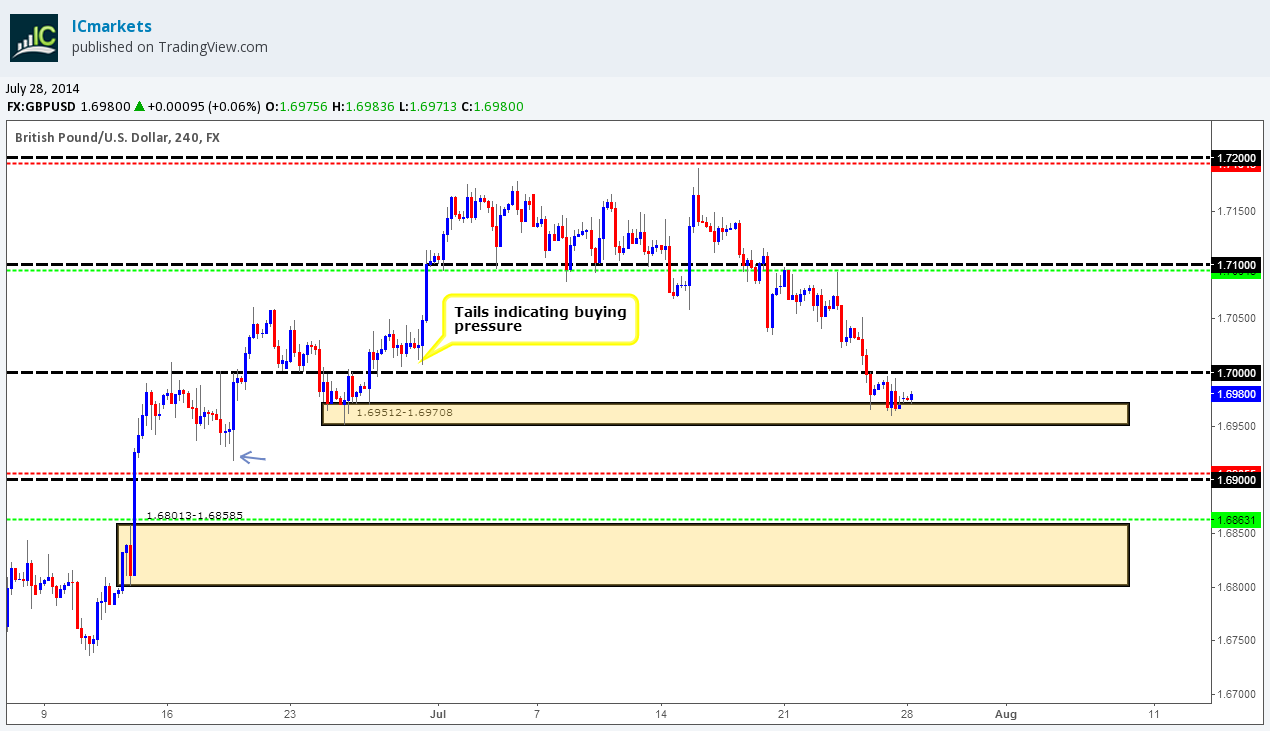
- Daily timeframe: Price is currently seen trading around a daily S/R flip level at 1.69712; no decision has been made to trade north or south that we can see at the moment. Price remains capped between the aforementioned daily S/R flip level and a daily S/R flip level just above at 1.70597, if we do see a break below (1.69712), price will likely visit the daily demand area at 1.67989-1.67367.
The market opened at 1.69766, and very similar to the EUR/USD pair above, little price action has been seen. This is to be expected though, as Monday’s are notoriously slow trading sessions.
The last analysis reported that we are favoring a break of the 4hr demand area at 1.69512-1.69708 which would in all likelihood push prices down to at least the round number 1.69. Our reasoning behind thinking this is due to the heavy selling currently being seen in weekly supply (see above for the levels) at the moment. The tail marked with an arrow represents possible demand/buyer consumption, meaning the path south may be clear below to the aforementioned round number. In addition to this, it would make perfect sense for pro money sellers to break the aforementioned round number (another reason why we only placed a P.A confirmation order here) and push prices even further south down to a 4hr decision-point area at 1.68013-1.68585, which is conveniently located just above daily demand at 1.67989-1.67367, so do keep an eye on this area for a possible bullish reaction in the near-term future.
Pending/P.A confirmation orders:
- New pending buy orders (Green line) are seen just above the decision-point area (1.68013-1.68585) at 1.68631. Our reasoning behind placing a pending buy order here rather than a P.A confirmation buy order is simply because of this 4hr decision-point area’s location on the higher timeframes (just above daily demand at 1.67989-1.67367).
- P.A confirmation buy orders (Red line) are seen just above the round number 1.69000 at 1.69055. The reasoning behind setting this order is because we have no logical area on this timeframe for a stop-loss
- Pending sell orders (Green line) are seen just below the round number 1.71000 at 1.70948. We have set a pending sell order here due to the fact we can place our stop just above the high 1.71167.
- P.A confirmation sell orders (Red line) are seen just below the round number 1.72000 at 1.71943. We have placed a P.A confirmation sell order here simply because these psychological levels are prone to deep tests/spikes, so sometimes it is better to wait for that all important confirmation.
Quick Recap:
Monday’s are notoriously slow moving sessions, so it sometimes is difficult to forecast for Tuesday’s sessions. We still however favor a drop below the 4hr demand area at 1.69512-1.69708 down to at least the round number 1.69 where we currently have a P.A confirmation buy order set at 1.69055. In addition, we would not be surprised to see the aforementioned round number level broken south and price trade down to a 4hr decision-point area at 1.68013-1.68585 (where we currently have a pending buy order set just above at 1.68631) due to its higher timeframe location (above daily demand at 1.67989-1.67367).
- Areas to watch for buy orders: P.O: 1.68631 (SL: 1.67932 TP: Dependent on price approach).P.A.C: 1.69055 (SL: Dependent on price action after the level has been confirmed TP: Dependent on approaching price action after the level has been confirmed).
- Areas to watch for sell orders: P.O: 1.70948 (SL 1.71211 TP: Dependent on price approach). P.A.C: 1.71943 (SL: Dependent on price action after the level has been confirmed TP: Dependent on approaching price action after the level has been confirmed).
AUD/USD:
4hr TF.
The higher-timeframe picture resembles the following:
- Weekly timeframe: The weekly timeframe is still depicting consolidating price action with the upper limits being seen at 0.94600 and the lower at 0.92046. Price is seen trading predominantly around the aforementioned upper limits at the moment.
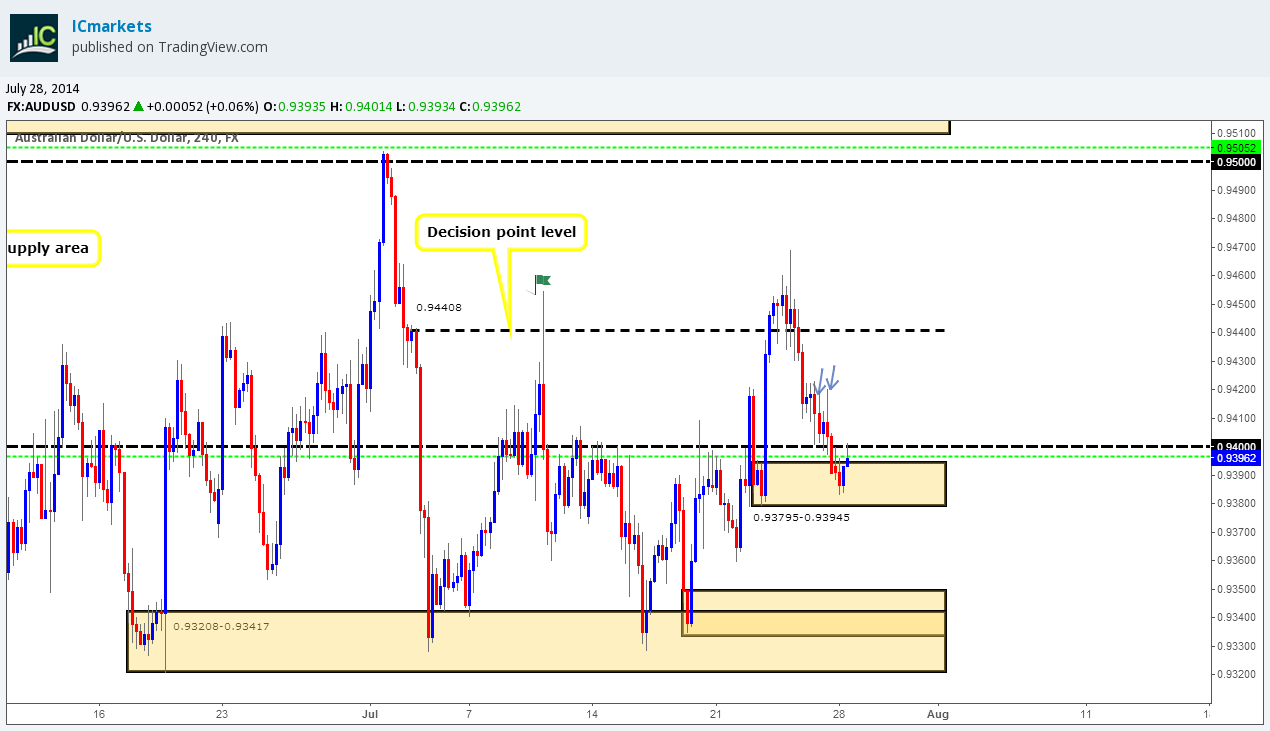
- Daily timeframe: Buyers and sellers have been trading within a small range on the daily timeframe with daily supply being seen above at 0.95425-0.94852 and a low below at 0.93208.
We mentioned in the last analysis that we were going to be watching price action very carefully at the open. The market opened at 0.93934, a small rally up to the round number 0.94 was seen, and then the sellers sold deeper into 4hr demand at 0.93795-0.93945. Quite heavy buying was seen coming into the market around the 0.93832 area which gave us confidence to hold on to our pending buy order set at 0.93967.
Buyers and sellers are now currently seen battling it out around the round number 0.94. If we see a break above the round number, price appears relatively free up to at least the 4hr decision-point level at 0.94408. The reason for this is simply because of those two wicks marked with arrows; supply may well have been consumed by those very two wicks meaning the path north should be clear.
Pending/P.A confirmation orders:
- The pending buy order (Green line) set just above a decision point area (0.93795-0.93945) at 0.93967 is now active, so do keep an eye out for a first take-profit level to be hit at 0.94408.
- P.A confirmation buy orders (Red line) are seen just above the decision point level (0.92566-0.92736) at 0.92775. The reason for placing a P.A confirmation buy order here rather than pending buy order is simply because we were trading just above a daily demand ‘buy zone’ at 0.92046-0.92354, meaning pro money could very well just ignore this level completely and trade deeper into the aforementioned daily demand area, so, confirmation is the order of the day!
- Pending sell orders (Green line) are seen just below supply (0.95425-0.95096) at 0.95052. A pending sell order is placed here due to this being an area where pro money was interested in before; see how close price came to the supply area? (Levels above), this indicates possible strong supply (selling pressure), so the next time price visits we can expect some sort of reaction.
- No P.A confirmation sell orders (Red line) are seen in the current market environment.
Quick Recap:
Our pending buy order set at 0.93967 has taken some heat on this trade! Ideally we want to see price close above the round number 0.94, this will give us added confidence the trade is good. Price is then relatively free to at least hit the 4hr decision-point level above at 0.94408.
- Areas to watch for buy orders: P.O: 0.93967 (Active) (SL: 0.93773 TP: [1] 0.94408 [2] 0.95000).P.A.C: 0.92775 (SL: Dependent on price action after the level has been confirmed TP: Dependent on approaching price action after the level has been confirmed).
- Areas to watch for sell orders: P.O: 0.95052 (SL: 0.95467 TP: Depending on price approach)P.A.C: No P.A confirmation sell orders seen in the current market environment.
USD/JPY:
4hr TF.
The higher-timeframe picture resembles the following:
- Weekly timeframe: A long-term weekly R/S flip level at 101.206 has been providing support to the market now since the 3rd of February 2014, so this is definitely a level worth watching.
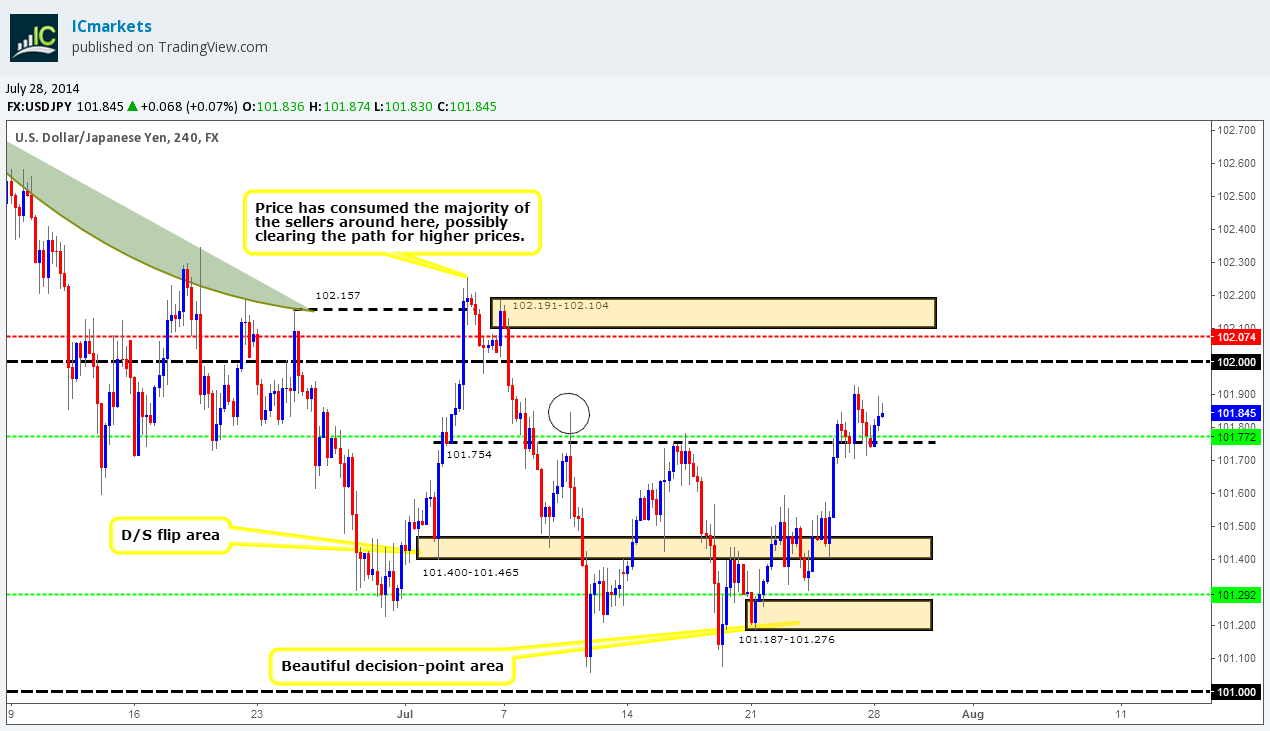
- Daily timeframe: Current trading action is taking place just below a daily supply area at 101.962-102.257, if we see a break above this area; it would likely confirm buying strength from the aforementioned weekly R/S flip level.
The market opened up at 101.769, the sellers then made a pathetic attempt to trade below the 4hr decision-point level at 101.754, but were quickly stopped as the buyers then took over pushing prices higher. Selling pressure is now being seen around the 101.902 area, this was to be expected. A break above the aforementioned level would likely seal the deal for a test of the round number 102 above at least.
The daily timeframe shows we are trading just below daily supply, but the weekly timeframe shows we are trading off of a weekly R/S level (for the levels, see above), so we are naturally expecting higher prices sometime soon, as we always support the notion: ‘higher timeframes usually overrule the lower ’.
Pending/P.A confirmation orders:
- Pending buy orders (Green line) are seen just above the decision-point area (101.187-101.276) at 101.292. The reason a pending buy order has been set here is because this remains an important area as this is the likely where pro money buyers made the ‘decision’ to push prices higher above the D/S flip area at 101.400-101.465, making this zone a magnet for a first-time reaction.
- The pending buy order (Green line) set just above the decision-point level (101.754) at 101.772 is now active, so do keep an eye out for our first take-profit level set at 102.000 to be hit.
- No P.A confirmation buy orders (Red line) are seen in the current market environment.
- Pending sell orders (Green line) are seen just below supply (103.294-102.983) at 102.953. A pending sell order was set here due to this being an area where likely unfilled sell orders are.
- P.A confirmation sell orders (Red line) are seen just below supply (102-191-102.104) at 102.074. A P.A confirmation sell order was used here purely for the simple fact we are trading around a higher-timeframe weekly support level at 101.206 meaning we may see a small reaction, but nothing to write home about, hence the need for confirmation!
Quick Recap:
Our pending buy order (101.772) at the time of writing is currently sitting nicely in the green. Selling pressure is seen coming in around the 101.902 area, if a break above this area happens, we can likely expect price will at least reach the round number 102, since there’s very little supply to the left between these two areas.
- Areas to watch for buy orders: P.O: 101.292 (SL: 101.166 TP: Dependent on price approach)101.772 (Active) (SL: 101.686 TP: 102.000 P.A.C: No P.A confirmation buy orders are seen in the current market environment.
- Areas to watch for sell orders: P.O: 102.953 (SL: 103.317 TP: Dependent on price approach)P.A.C: 102.074 (SL: likely will be set at 102.214 TP: Dependent on approaching price action after the level has been confirmed).
EUR/GBP:
4hr TF.
The higher-timeframe picture resembles the following:
- Weekly timeframe: Current price action is seen trading just above weekly demand at 0.79631-0.78623. As we see it, price still has room to drop further into the aforementioned weekly demand area due to there being likely consumed demand area to the far left.
- Daily timeframe: A break south has been seen below daily demand at 0.78862-0.79206, price should be relatively free now to hit the next daily demand area below at 0.78117-0.78533, however, expect the possibility that price may rally to the 0.79751 area before hitting the aforementioned daily demand below.
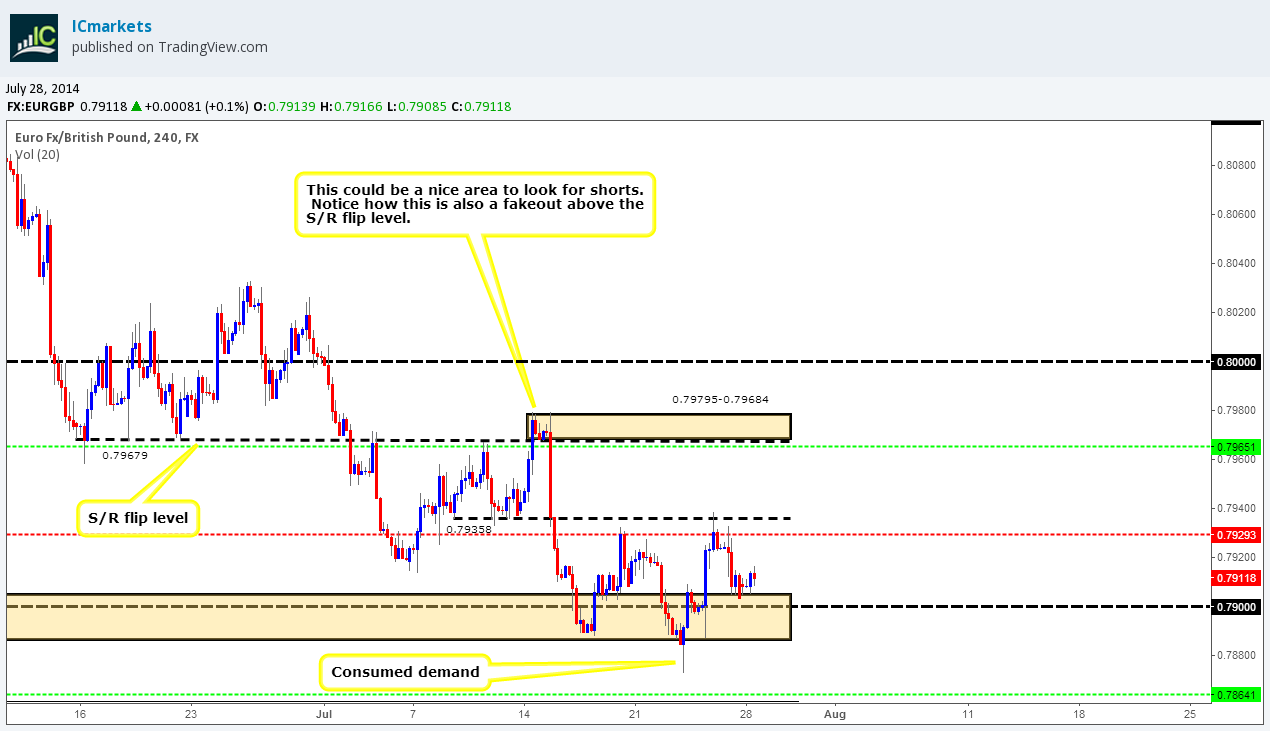
Current price action shows price to be capped between a 4hr S/R flip level at 0.79358 and a weak-looking 4hr demand area at 0.78862-0.79048.
The market has not seen much action since it opened at 0.79091, both buyers and sellers seem very indecisive at the moment. We believe a small rally north is likely to be seen around the aforementioned 4hr S/R flip level at 0.79358 or 4hr supply above at 0.79795-0.79684before lower prices are seen. Why do we believe this? The weekly timeframe is NEARLY at the weekly demand area, and has a little way to go before reaching this, also as reported above, the daily timeframe analysis predicts we will see a small rally higher before lower prices are seen, due to the consumed daily demand area (for levels, please see above). So, taking this all into consideration, higher prices are likely to be seen on the 4hr timeframe before a much bigger sell off is seen to around 4hr demand below at 0.78602-0.78320 which is also neatly located just above daily demand at 0.78117-0.78533.
Pending/P.A confirmation orders:
- Pending buy orders (Green line) are seen just above demand (0.78602-0.78320) at 0.78641. The reasoning behind setting a pending buy order here is due to its current location on the higher timeframes. Our 4hr demand area is just above daily demand at 0.78117-0.78533 and also just within the upper area of weekly demand at 0.76931-0.78623.
- No P.A confirmation buy orders (Red line) are seen in the current market environment.
- Pending sell orders (Green line) are seen just below the supply area (0.79795-0.79684) at 0.79651. The reason for a pending sell order being set here, rather than a P.A confirmation sell order was because this area looks very hot for a first-time reaction. Notice how price faked above the S/R flip level at 0.79679 then dropped back down, there is very likely unfilled sell orders still lurking around this area, hence the need for a pending sell order.
- New P.A confirmation sell orders (Red line) are seen just below the 4hr S/R flip level at 0.79358 at 0.79293. We have set a P.A confirmation sell order because price could very well smash straight through this level up to the 4hr supply area at 0.79795-0.79684 which is beautifully located around the daily S/R flip level at 0.79751.
Quick Recap:
Price has been dancing around 4hr demand at 0.78862-0.79048 since the open. Traders should be ready for the possibility of a rally higher to either the 4hr S/R flip level at 0.79358 or the 4hr supply above at 0.79795-0.79684 before an overall bigger sell off commences down to an obvious area of 4hr demand at 0.78602-0.78320.
- Areas to watch for buy orders: P.O: 0.78641 (SL: 0.78288 TP: Dependent on price approach)P.A.C: No P.A confirmation buy orders are seen in the current market environment.
- Areas to watch for sell orders: P.O: 0.79651 (SL: 0.79828 TP: Dependent on price approach)P.A.C: 0.79293 (SL: Dependent on price action after the level has been confirmed TP: Dependent on approaching price action after the level has been confirmed).
USD/CAD:
4hr TF.
The higher-timeframe picture resembles the following:
- Weekly timeframe: a strong push up to weekly supply at 1.09592-1.08133 was seen. Price still remains capped between the aforementioned weekly supply area and weekly demand below at 1.05715-1.07008. If we see a break of the weekly supply area, things will start to get very interesting as we believe the profit potential to the upside is huge.
- Daily timeframe: Price is now seen trading around an obvious daily S/R flip level at 1.08277, and to anyone who does not follow above the daily timeframe, all this is, is the area around the base of the aforementioned weekly supply area above. A break above this daily S/R flip level could see prices testing the upper daily supply area at 1.09592-1.09156, which is of course very deep within weekly supply.
The market opened at 1.08154, price consolidated for a little while then made a run to retest the round number 1.08. We still do not expect price to fully react bullishly off of this round number, instead, we expect a break south down to at least the 4hr decision-point area at 1.07546-1.07680. As long as price remains trading between the 4hr decision-point area at 1.08250-1.08123 and the round number, our analysis may still be correct. Our reasoning behind a break of the round number is simply because we are trading into some heavy higher-timeframe supply (See above for the levels), so lower prices are naturally expected to be seen soon.
Pending/P.A confirmation orders:
- Pending buy orders (Green line) are seen just above the decision-point area (1.07546-1.07680). We have set a pending buy order here as this remains an important area where pro money buyers likely made the decision to break the round number above at 1.08000. We are not expecting a massive reaction here, more a small bounce which we will quickly take advantage of, as we are fully aware that we’re currently trading around higher-timeframe supply at the moment (Weekly: 1.09592-1.08133 Daily S/R flip level: 1.08277).
- P.A confirmation buy orders (Red line) are seen just above the round number 1.07000 at 1.07047. The reason a P.A confirmation buy order was set here is simply because a pending buy order would be too risky as (on this timeframe) there is no logical area for a stop loss order to be placed.
- No pending sell orders (Green line) are seen in the current market environment.
- No P.A confirmation sell orders (Red line) are seen in the current market environment.

Quick Recap:
With price currently trading around some heavy-weight supply (Weekly: 1.09592-1.08133 Daily S/R flip level: 1.08277), we are expecting the round number 1.08 to be broken south, and to trade down to the 4hr decision-point area at 1.07546-1.07680 at least. We currently have a pending buy order (1.07706) set above this area, we know this may be risky, but this area still remains important and could still be very good for a bounce at the very least
- Areas to watch for buy orders: P.O: 1.07706 (SL: 1.07514 TP: Dependent on price approach)P.A.C: 1.07047 (SL: Dependent on price action after the level has been confirmed TP: Dependent on approaching price action after the level has been confirmed).
- Areas to watch for sell orders: P.O: No pending sell orders seen within the current market environment. P.A.C: No P.A confirmation sell orders seen within the current market environment.
USD/CHF:
4hr TF.
The higher-timeframe picture resembles the following:
- Weekly timeframe: Price broke the mundane range that formed above weekly demand at 0.85664-0.88124. If the buying pressure continues, we will very likely see price hit an important weekly decision-point level at 0.90927.
- Daily timeframe: A break above daily supply at 0.90372-0.90042 was recently seen. It is very likely that the sellers are now consumed around the aforementioned daily supply area, thus clearing the path up to around the next daily supply area at 0.91556-0.90985. There is very little to left that we can see that will cause a problem to price if the buyers wanted to push it up that far. Notice the wicks seen in between these two areas? These wicks likely indicate supply consumption which makes the possibility of higher prices even stronger, but if pro money does not have the required liquidity, in this case sell orders to buy into, they will have to reverse price. We can see two obvious areas where they may reverse price to, a small daily demand area at 0.89973-0.89311 or the daily S/R flip level at 0.88608 below.
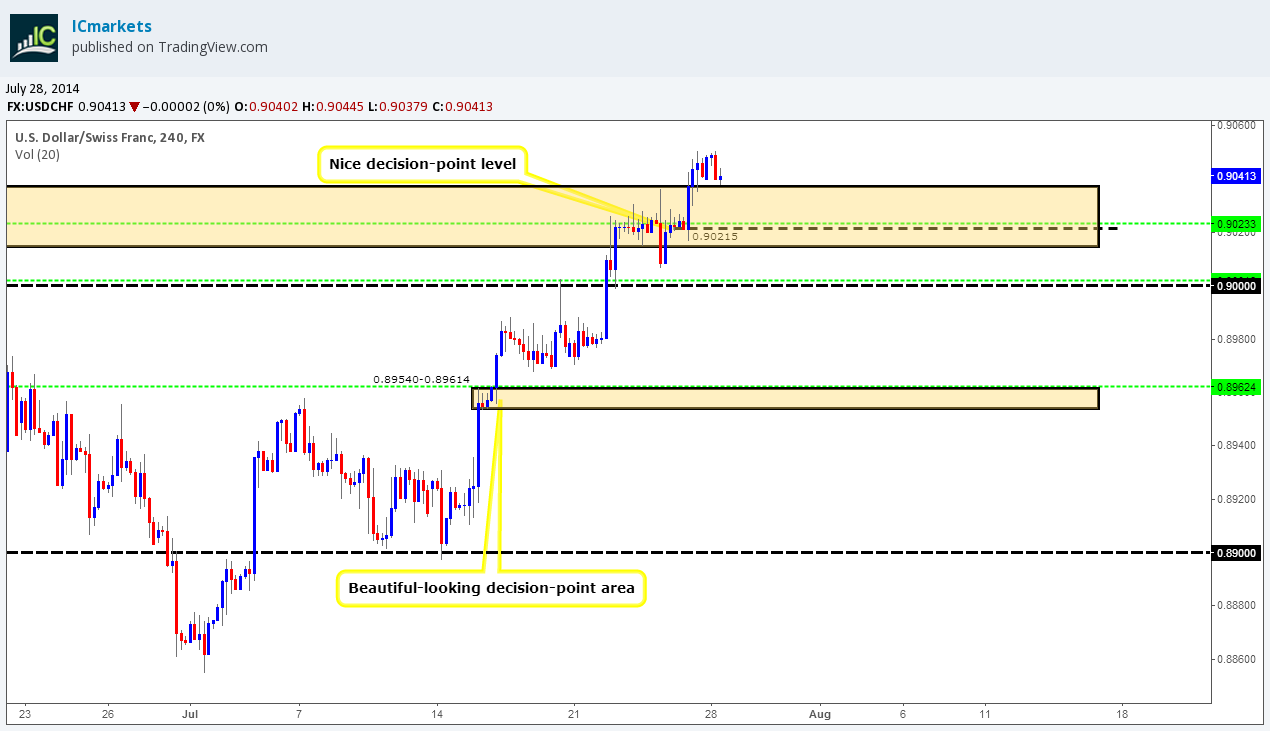
The market opened at 0.90404, price action ever since then has not been very exciting, in fact all we have seen is consolidating action above the 4hr supply area at 0.90372-0.90148.
Monday’s can sometimes be very slow as already mentioned concerning other pairs, as a result our last analysis still holds true and is well worth remembering:
A break above the aforementioned 4hr supply area has likely opened up the possibility to much higher prices. Take a look to the left of the chart above this 4hr supply area. We can see lots of wicks indicating supply has been consumed right up to a 4hr S/R flip level at 0.90891, essentially all this does is confirm our daily analysis with a more magnified view. A rally straight up to this 4hr S/R flip level is unlikely since pro money may not have the required liquidity to push price higher immediately, instead a reversal may be seen down to the 4hr decision-point level at 0.90215, or if the sellers have the strength, a further push south may be seen towards the round number 0.9 before the higher prices are seen to gain the much-needed sell orders to buy into.
Pending/P.A confirmation orders:
- Pending buy orders (Green line) are seen just above the round number 0.90000 at 0.90018. We would not normally set a pending buy order around a round number level such as this; however the first retest seen of this level gives us confidence to place an order such as this.
- Pending buy orders (Green line) are seen just above the decision-point level (0.89540-0.89614) at 0.89624. A pending buy order was placed here because this area remains an important decision-point area where the buyers ‘decided’ to trade above multiple highs to the left.
- Pending buy orders (Green line) are seen just above the decision-point level (0.90215) at 0.90233. The reasoning behind placing a pending buy order here is simply because this is the area on the 4hr timeframe where pro money buyers likely made the decision to break above the 4hr supply area at 0.90372-0.90148, hence the possibility there may still be unfilled buy orders lurking around this level.
- No P.A confirmation buy orders (Red line) are seen in the current market environment.
- No pending sell orders (Green line) are seen in the current market environment.
- No P.A confirmation sell orders (Red line) are seen in the current market environment.
Quick Recap:
Much the same as the last analysis, but still serves as an important reminder:
A break above 4hr supply at 0.90372-0.90148 has been seen on the 4hr timeframe, we can likely expect a rally up to at least the 4hr S/R flip level at 0.90891 soon, however, we must be prepared for a reversal south beforehand down to at least the 4hr decision-point level at 0.90215, which is where we have a pending buy order set just above at 0.90233.
- Areas to watch for buy orders: P.O: 0.89624 (SL: 0.89523 TP: Dependent on price approach) 0.90018 (SL: 0.89928 TP: Dependent on price approach) 0.90233 (SL: 0.90117 TP: Dependent on price approach). P.A.C: No P.A confirmation buy orders seen in the current market environment.
- Areas to watch for sell orders: P.O: No pending sell orders seen in the current market environment. P.A.C No P.A confirmation sell orders seen in the current market environment.
XAU/USD (GOLD)
4hr TF.
The higher-timeframe picture resembles the following:
- Weekly timeframe: Selling pressure has begun to weaken out of weekly supply at 1391.97-1328.04 with two relatively long tails being seen indicating buying interest. Price is currently capped between the aforementioned weekly supply area and a nice-looking weekly decision-point level below at 1244.08.
- Daily timeframe: Current trading action is seen between the ignored daily decision-point level at 1292.52 and a daily decision-point level above at 1318.96. A break above would likely force price to test a nice-looking daily supply area at 1344.91-1333.55, conversely, a break below would likely see price testing a long-term daily S/R flip level at 1277.36.
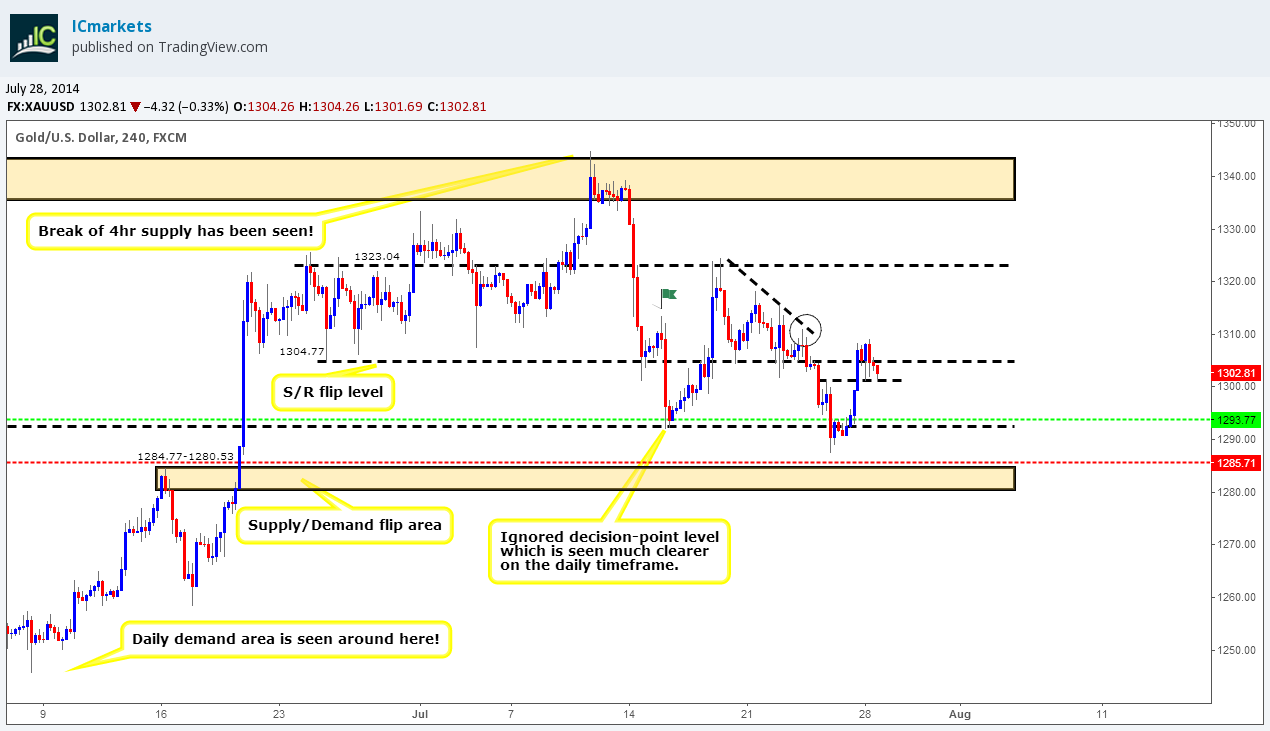
The market opened at 1307.37, price spiked through the 4hr S/R flip level at 1304.77 down to a minor 4hr S/R flip level at 1301.16 which clearly gave extra support here during that time.
However, price has now closed below the 4hr S/R flip level at 1304.77; we are now going to be watching the 4hr minor S/R flip level just below at 1301.16 for a bullish reaction since this level could very well push prices above the high marked with a circle at 1311.07 which is exactly what we want to see. As mentioned in the last analysis: if we see a break above the high marked with a circle at 1311.07, then there is very little stopping price from hitting the 4hr R/S flip level above at 1323.04. Our reasoning behind thinking this is because of price action to the left. The small trendline is not there to depict a trend as such, it is more to show how pro money likely consumed the sellers as price was declining, thus very likely clearing the path north for the buyers in the future.
Pending/P.A confirmation orders:
- The pending buy order (Green line) set just above the ignored decision-point level at 1292.52 at 1293.77 is now active. Our first take-profit level was hit late Friday at 1304.77, so do keep an eye out for our second and final take-profit level set at 1323.04.
- P.A confirmation buy orders (Red line) are seen just above the S/D flip area (1284.77-1280.53) at 1285.71. We have set a P.A confirmation buy order here simply because we could not find a logical area for the stop-loss order, so to avoid any deep spikes; we have decided to wait for confirmation.
- No pending sell orders (Green line) are seen in the current market environment.
- No P.A confirmation sell orders (Red line) are seen in the current market environment.
Quick Recap:
A break above the high marked with a circle at 1311.07 has unfortunately not been seen yet. Our pending buy order set at 1293.77 is still active and in the green. We are watching the minor 4hr S/R flip level at 1301.16 very carefully at the moment as this level could very well push prices higher above the aforementioned high, conversely, a break below here would likely warrant us to close our long position.
- Areas to watch for buy orders: P.O: 1293.77 (Active) (SL: 1286.75 TP: [1] 1304.77 [2] 1323.04).P.A.C: 1285.71 (SL: Dependent on price action after the level has been confirmed TP: Dependent on approaching price action after the level has been confirmed).
- Areas to watch for sell orders: P.O: No pending sell orders seen in the current market environment. P.A.C: No P.A confirmation sell orders seen in the current market environment.


