
Previous Story
Wave analysis of gold for March 23, 2017
Posted On 23 Mar 2017
Comment: 0
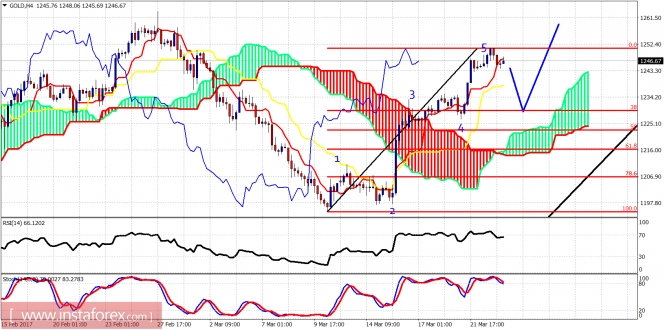
Gold price has most probably completed an impulsive wave upwards from $1,194 lows. The price is showing reversal signs. A short-term correction should unfold from current levels towards $1,220-30. Gold is in a bullish trend. I remain long-term bullish for Gold.
Gold continues to trade above the Ichimoku cloud. The price is expected to pull back towards the 4th wave area and close to the 38% Fibonacci retracement at least. Trend is bullish in the medium term. Confirmation of the bullish trend will come once the price breaks above $1,263 highs.
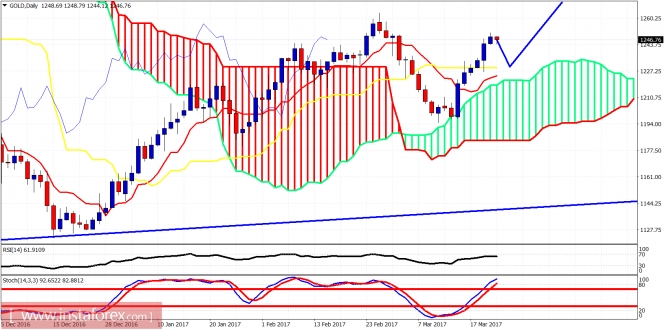
On a daily basis Gold price has broken above both the tenkan- and kijun-sen. A cross over between those two indicators with the tenkan-sen (red line indicator) above the kijun-sen (yellow line indicator) will be a very bullish signal. The price is above the Kumo (cloud support). Gold is expected to make a wave 2 pullback towards the kijun-sen and then explode to the upside for wave 3 and $1,300-$1,330. Support is at $1,194.The material has been provided by InstaForex Company – www.instaforex.com


