Previous Story
Weekly Technical Analysis – Bonus Video
Weekly Bonus Analysis Video: S&P500, USDJPY and USDCAD (6 min 40 sec)
TEXT:
Hello everybody ..welcome to our Weekly Bonus Analysis Video ..I’m Stef Breschi and today is Saturday 17th October 2015Today we’ll be looking at the SP500 as usual where we took a nice profit last week and 2 currency pairs ..USD Yen and USD Canada ….…to be fair to our Subscribers this week Gold and WTI Crude are covered in our STTS subscription service as we have positions in them.
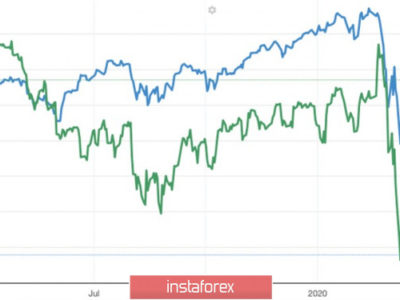
S&P500
(Daily Chart) as you know we went long a while ago just at 1900 with a Stop below 1860. Original target 2000 but we moved it to 2040. We enjoyed the recent run-up which came to an end as we took our profit as the market dipped mid-week at 1995 thinking price would retrace further giving us a change to re-enter Long lower down. Unfortunately price bounced right off the level at which we took profit although we don’t mind as we made 950 pips on this trade.
Thursday’s bounce off 1995-2000 level which was resistance and turned to support, represents a change in polarity, which is quite bullish as price approaches our original target of 2040-2045 which did show major significance (zooming out) earlier in the year. But it’s difficult to go Long here as there is a lot of resistance above: the 200sma, 2070 and then all the choppy congestion above that from last year. So next week we will be sidelined looking for a potential retracement to go Long.
USDJPY
(Weekly) price settled in 1.19-1.20 which is a range where this pair stagnated for months last year and earlier this year. So it will be tough to trade in coming weeks. The bullish effect of the weekly pin bar back in August has not followed through.
(Daily) Price has been chopping sideways since that pin bar and we have been trying to rationalize the recent consolidation calling first a triangle and now a channel (118.25-121.70) .. so a Long could be worth looking at but in order to see a test of the upper end of this channel price would need to break above the 20ema which has not been able to do until now. SO having missed the swing Buy at 118.25 we are going to remain sidelined for a while as this market can only be traded by short term swing traders which we at TFF are not.
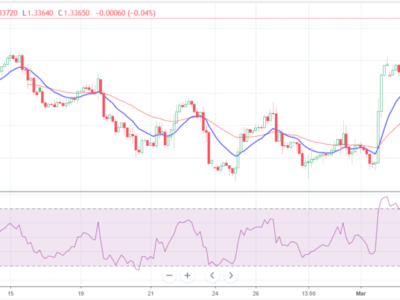
USDCAD
(Daily Chart) it has dumped in recent weeks which we missed. Last week we attempted a Long looking for a retracement to the 50 sma but it did not happen and we were stopped out. Luckily only in half risk.
We still see this level around 1.2900 as major support as it coincides with the 38.2 Fib level of the last big move. So we may still go Long in half risk next week if we see evidence of a bounce but we see 1.2690 and the 200 sma as ultimate targets for this pair so if we do get a retracement anywhere near the 50 sma we will also look to sell into it.Thank you for watching .. please take a look at our subscription service STTS (Short Term Trade Setups) which covers also other major currencies and other markets which we are likely to trading and includes entry levels, stops and targets combined with our tried and tested risk management strategy
Come and find us on tff-onlinetrading/market analysis
Have a great week
DISCLAIMER
The information contained in this publication is not intended as an offer or solicitation for the purchase or sale of any financial instrument. Users acknowledge and agree to the fact that, by its very nature, any investment in CFDs and similar and assimilated products is characterised by a certain degree of uncertainty and that, consequently, any investment of this nature involves risks for which the user is solely responsible and liable.
Any recommendation, opinion or advice contained in such material reflects the views of TFF, and TFF expressly disclaims any responsibility for any decisions or for the suitability of any security or transaction based on it. Specifically, any decisions you may make to buy, sell or hold a security based on such research will be entirely your own and not in any way deemed to be endorsed or influenced by or attributed to TFF.
Past performance should not be seen as an indication of future performance. Market and exchange rate movements may cause the value of your investment to rise or fall and an investor may not get back the amount invested.
Eligibility for participation in the capital pool is subject to final determination and acceptance by TFF.
Investments are not obligations of, deposits in, insured or guaranteed by TFF.