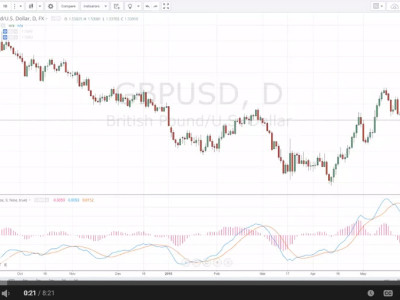
What Can the Q-Stick Indicator Do for You?
Let’s say you were asked to enter the foreign exchange market. Particularly, you were assigned the task of analyzing whether a security can retain its strength for a certain period of time with the use of a candlestick chart; if it can’t show strength, is its weakness reliable? To accomplish the assignment, presented to you are useful data, which includes the opening price, closing price, and simple and exponential moving averages.
What you do is up to you, and what you can do is use the Q-Stick Indicator.
What Is the Q-Stick Indicator?
The Q-Stick Indicator, or the Quick Stick, is a technical indicator; it was developed by trader, scientist, author, and engineer, Tushar Chande, as a technique of measuring volume in candlestick patterns. It provides a representation of a security’s exponential moving average (or EMA), opening price, closing price, and their difference, as well their simple moving average (or SMA).
The Rules
The rules when trading with the use of the Q-Stick Indicator state that when the tool goes above the exponential moving average (i.e. the EMA is used as a signal line), a buy signal was generated; it suggests that market prices are going down. Conversely, if it goes below or fails to reach the exponential moving average, market prices are high; it’s recommended to take advantage of a selling position.
The values that are shown by the Q-Stick Indicator determine market conditions. Particularly, they draw light on overbought conditions and oversold conditions. If the figures are below 0 and black candlesticks appear on the chart, there’s a major chance of a bearish market. On the other hand, if the figures are above 0 and white candlesticks appear on the chart, you’re looking at bullish market conditions.
The formula:
QSI = [closing price – (opening price X n)] X SMA
**representations: n = period of time
The Tactics
The Q-Stick Indicator is a versatile tool; there are various ways of using it. Apart from turning to the exponential moving average as a signal line, you can employ it to point out market conditions, strengths, weaknesses, and different kinds of incoming trends. To minimize the chances of possible losses, it’s advised to always wait for an indication or a price confirmation.
Options when using the Q-Stick Indicator:
- Calculate the simple moving average, and use it as a trigger point; buy or sell depending on the results
- Buy once the tool crosses over 0; sell once it fails to cross 0 or remains under 0
- Buy once the tool is indicating an uptrend or once the market prices are going down; sell once it is indicating a downtrend or once the market prices are heading up
- Buy once the tool is indicating an extremely low level; sell once it is indicating an extremely high level


