Previous Story
A Look at the US Dollar Index

Over the last few months especially, there’s been a lot of focus in the world of Currency Trading upon the state of the US Dollar. No matter what your opinion is of the Greenback, it is still, without question, regarded as the world’s primary reserve currency and holds its weight of recognition across the board. Any active trader in today’s FX markets should be aware of the performance of the dollar at any given time not only because of its status as the world’s leading currency, but also because it can give us clues as to the behavior of other currency pairs as well. This is a key concept which is taught in the Online Trading Academy Professional Forex Trader class, because we know the importance of the US dollar when trading the global currency markets. Just by knowing the value of the dollar and how its current price relates to previous levels historically can give the disciplined trader a distinct advantage over the competition.
Without a doubt, the best way to track the ongoing price changes in the US dollar is by charting and analyzing the dollar index itself. The Dollar index (DXY) is very similar to a stock market index. Where a stock index is made up of different stocks, the dollar index is comprised of a basket of different currencies that are weighted against the dollar itself, giving us a measurement of how the buck is performing against other denominations. The structure looks like this:
– Euro (EUR) 57.6%
– Japanese Yen (JPY) 13.6%
– British Pound (GBP) 11.9%
– Canadian Dollar (CAD) 9.1%
– Swedish Krona (SEK) 4.2%
– Swiss Franc (CHF) 3.6%
As you can see, the Australian dollar and the New Zealand dollar are not included and obviously the index was comprised of many more currencies before the introduction of the EUR, hence the Euro’s current majority weighting. Some argue that the index itself needs to be upgraded and adjusted to be a fairer reflection of the current markets, with an update of other currencies which play their part in the global economy too; but that is a discussion for another time. Now we know how the DXY is created, let’s take a look at the chart itself:
This is a screenshot of the DXY at the back end of 2011. As you can see, it is a chart not unlike any other currency chart that you may have seen. A rise in the chart shows us dollar strength, with a fall in the chart representing dollar weakness.
I remember very clearly teaching classes and giving commentary on the markets when the dollar was at these levels back in 2009 to 2011. I remember at the time how people were talking about the demise of the buck due to its continual weakness over that two year period. The market was pretty much back to where it was when it was at its lowest ever point in 2008, recording a price of 70.698 back in March of that year. This is a stark contrast to where we are now, with the dollar, itself, having rallied consistently since July of last year with little pause or pull back. This is how things look now:

When you look at that chart it truly is an amazing turnaround, yet is it an unexpected one? To somebody like me who focuses on price alone and chooses to take fundamental analysis with a pinch of salt, I would say it really isn’t that surprising. If you look back at the charts between 2008 and 2011 you’ll notice that the market was extremely undervalued and on numerous occasions it failed to break the lows of 2008, which I regard as a great sign that any market can rally when in this situation.
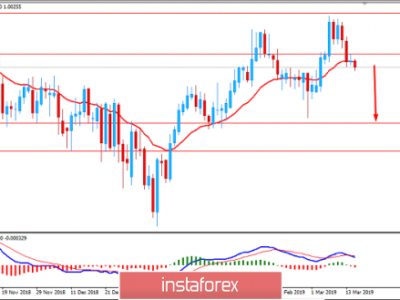
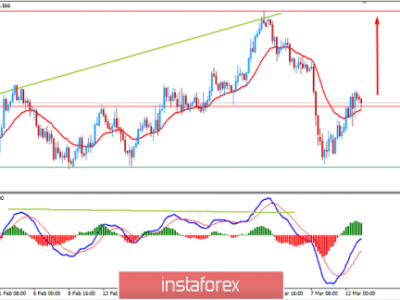
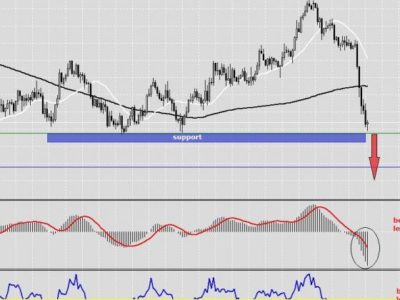
It can often be difficult and challenging to put your attention into what could happen next, instead of focusing on what has been happening so far. Sure it is easy to assume that the US dollar is going to continue its gains and according to the charts this is a possibility, however is it really any different to when the market was at its lows back in 2011? In our school we focus purely on the concept of recognizing institutional supply and demand on price charts. When we know what this picture looks like, it gives us the opportunity to analyze and potentially predict where the next market turn is going to occur. Looking back to our chart from 2011, we can see the dollar was sitting down right on top of major levels of demand. Those demand levels held and resulted in a big rally in the greenback. Now, after this rally we are approaching and are right under major levels of supply, which look like this:

As we can see, that overextended rally that we have witnessed on the dollar is now entering some major levels of supply which could cause a real challenge to the current upwards momentum. Yes, there is room for this market to continue to the upside but as unemotional and objective traders we must be aware of the imbalances in the market where previous major selling and buying took place and respect these levels accordingly. I would not be surprised to see a decent correction in the dollar at these major levels of supply with the market potentially picking back up at the newly formed levels of demand. This would have a big impact on other currency pairs like the EURUSD, GBPUSD and the AUDUSD, which are all heavily oversold, themselves.
By keeping one eye on the DXY, we can get a distinct heads up of what is to come, and this proves to be a useful analytical tool when trading other major currency pairs. As a rule of thumb, I always analyze the DXY on a daily and weekly basis and use it as a gauge to measure my expectations for the upcoming trading opportunities in front of me. I hope this was helpful.
Until next time take care,
Sam Evans
sevans@tradingacademy.com
Source:: A Look at the US Dollar Index