
Previous Story
A Quicker Trade Signal Using MACDs Histogram
Posted On 15 May 2014
Comment: 0
By Rob Pasche, Forex Trading Instructor
Talking Points:
- The MACD and Signal line crossover gives traditional buy/sell signals.
- Histogram is the difference between the MACD and Signal line.
- We can enter when Histogram begins to get smaller rather than wait for a cross.
Most technical traders have experience using the more popular oscillators, RSI, CCI, and MACD, etc. But many traders I’ve taught are not aware of the alternative way to use the MACD. In this article we will discuss how to use MACD’s histogram to open trades and show how in many cases we can get a quicker entry than the traditional MACD method.
What Does the Histogram Represent?
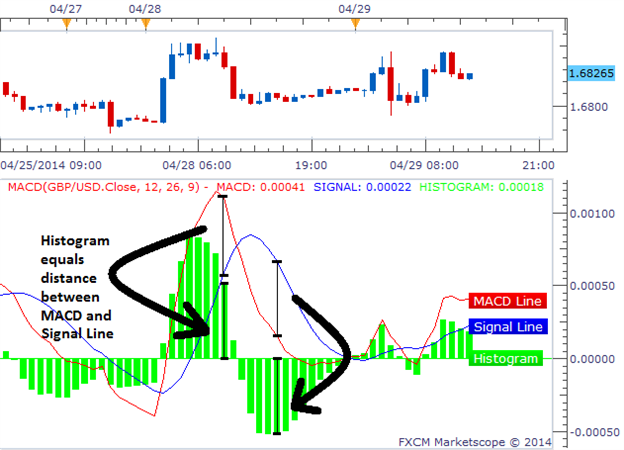
The green histogram or “bar chart” included in the background of the MACD displays the difference between the MACD and Signal line. When the MACD is above the Signal line, the bar is positive. When the MACD is below the Signal line, the bar is negative. The actual height of the bar is the difference between the MACD and signal line itself.
Learn Forex: MACD’s Histogram Construction
(Created from FXCM’s Marketscope 2.0)
The chart above shows what the Histogram represents. The first label shows how the MACD is higher than the Signal line. This creates a positive green bar that has a height equal to the difference of the two lines. The second example the MACD is below the Signal line. This creates a negative green bar that has a height equal to the difference between the two lines. We can also see that when the Blue and Red lines cross, the histogram flips from one side to the other.
How to Enter Based On the Histogram
So how can we read the histogram to generate trade signals? We first want to track the histogram as it moves away from the zero line, in other words, track it as its bars grow larger. The actual signal comes when the histogram no longer gets larger and produces a smaller bar. Once the histogram prints a smaller bar, we look to trade in the direction of the histogram’s decline. We can see an example of this in the chart below:
Learn Forex: MACD Histogram Entry Logic
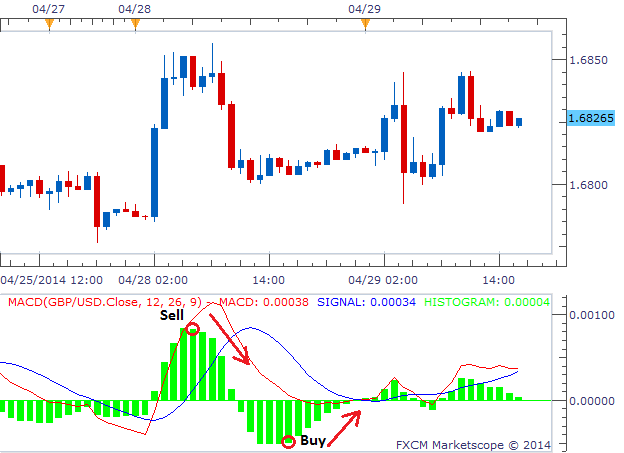
The Sell signal on the left was created by four growing bars in a row followed by a fifth bar that closed smaller. Five bars later, we see the MACD line crossing below the Signal line which is a traditional MACD signal. This later signal would have missed a majority of the move that the Histogram signal would have caught. Therefore, using the histogram as a signal can earn us a greater number of pips.
The Buy signal on the right is a similar story. We saw four bars growing consecutively until a 5th bar was created that equaled the 4th. We want to wait until a bar is smaller, so the trigger would have been presented after the 6th bar closed. This buy trade came several bars before the MACD/Signal cross and gave us a better entry as well.
Once we are in the trade, we can use sound Money Management to close out the trade appropriately.
And The Rest is Histogram
This entry strategy is fairly straight forward and can quickly be adopted by a technical trader. Have you traded in the forex market before? If not, test out this trading technique using a FREE FXCM Demo account. There is no risk and you can be up and running in minutes.
Good trading!
—Written by Rob Pasche
To contact Rob, email rpasche@dailyfx.com.
Sign up for my email list to stay up to date with my latest articles and videos.
Take this free 20 minute “New to FX” course presented by DailyFX Education. In the course, you will learn about the basics of a FOREX transaction, what leverage is, and how to determine an appropriate amount of leverage for your trading.
Register HERE to start your FOREX learning now!
Source: Dailyfx Trading Tips


