
Previous Story
Analysis of Gold for July 04, 2017
Posted On 04 Jul 2017
Comment: 0
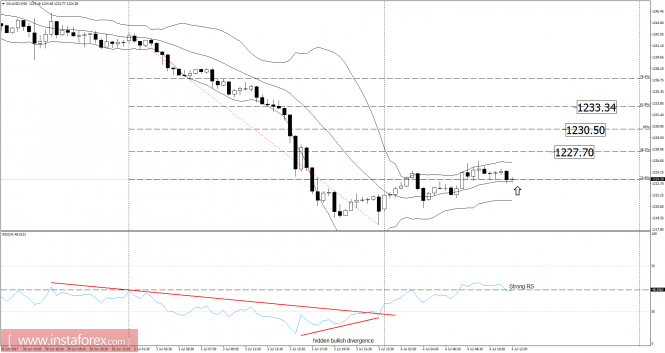
Recently, the Gold has been trading downwards. The price tested the level of $1,218.48. Anyway, according to the 30M time frame, I found potentially hidden buying activity. There is a hidden bullish divergence on the Moving Average Oscillator and there is a strong Relative Strength. My advice is to watch for a potential buying opportunity. I placed Fibonacci retracement to find potential upward targets. I got FR 38.2% at the price of $1,22770, FR 50% at the price of $1,230.50 and FR 61.8% at the price of $1,233.00.
Resistance levels:
R1: $1,238.20
R2: $1,252.00
R3: $1,262.00
Support levels:
S1: $1,214.00
S2: $1,205.00
S3: $1,191.20
Trading recommendations for today: watch for potential buying opportunities.
The material has been provided by InstaForex Company – www.instaforex.com
Source:: Analysis of Gold for July 04, 2017


