Previous Story
Are the Current Forex Moves Too Big?

Hello traders! I was recently talking to a few new students in one of our on location forex classes, and they were “concerned” about the recent strong moves in the currency markets, specifically US dollar pairs. Their concerns were really more about the question, “have things gone too far too fast?” Which led to their next questions, which boiled down to “should we start shorting the dollar, going against this quick bullish move?” This is a very common thought process, especially for new traders!
On the other hand, many new students that I meet have been trying to do one of two things: buy AFTER a strong move up thinking the trend will continue; or sell AFTER a big move down. This is more commonly known as trying to “pick tops or bottoms” which is, essentially, going against the move. Both strategies can be very hazardous to your trading account!
As we discuss some of these current moves, you may want to refer to your own charting packages to take a peek at the charts, as I don’t have enough space here to put in every pair. Very often I will look back on a much bigger picture time frame to see if a current move is unusual in a currency pair’s history. My preferred time frame for this analysis is a monthly chart, meaning each candle shows one full month of trading activity. This way you can get a much clearer picture of a currency pair’s history and see if our current moves are outside of a historical normal movement.
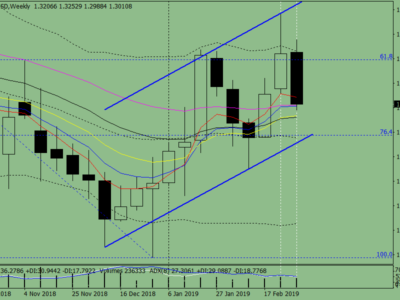
In this chart of the GBPUSD, you can see that we have had a pretty fast move to the downside (dollar strength) over the past few months. (Please refer to your own charts for a shorter time frame view.) On smaller time frames, the GBPUSD has gone almost straight down since last July, a move of nearly 25 cents, of 2500 pips! Now, before you run out and try to “buy the bottom” of this pair, take a look at my longer term monthly chart. I’ve marked a few down moves on the GBPUSD, along with their corresponding percent declines. Since July, this pair has had a move down of about 14.5%, which is a pretty big move, wouldn’t you say? But is it a large move in the GBPUSD’s history? Going back to about 1980, you can see that this current move is really not that unusual. Of the down moves that are marked on this chart, it isn’t even the largest move down! While there are smaller percent moves over the last few decades, they look to be mere retracements in a bigger trend. Measuring from major highs to lows gives us very significant percent changes, often more than double the move that we are currently experiencing. Suddenly that 14.5% doesn’t seem very large!
Now, look at your own charts of the EURUSD and measure the current move to the downside. It looks to me as if this move started in early May, giving us approximately a 25% downside move. Over the past ten years, this is the largest downside move the EURUSD has had! However, is it the largest ever? The answer is no. Back toward the end of 1998 to the end of 2000, the EURUSD had a move down of about 33%. Measuring from the highs in 2008 to our current lows, this is about a 34% move which is interesting. Just for fun, I measured a 33% move from last May’s highs which puts the EURUSD at .9300, still hundreds of pips away!
For our last pair this week, take a look at the AUDUSD. In its current move down, measured from the highs in 2011 to now, we have about a 31% pullback. But again, this is not a wildly unusual move when looking at the AUDUSD history. Looking all the way back to the mid 1970s, the AUDUSD has had several down moves of over 30%, with three moves being over 38%!
Our last bit of charting will be done on the $DXY, the dollar index. Because of the way currency pairs are quoted, this will be measured to the upside to show dollar strength moves, while the three currency pairs mentioned all show dollar strengthening moves by moving lower.

Over the last few decades the US dollar has had several strong moves to the upside; while the current move is obviously a FAST move, historically speaking it isn’t even close to being the FARTHEST move.
So, how can our new students us this information? As stated in numerous Lessons from the Pros newsletters, using our core strategy of buying in demand in uptrends and selling in supply in downtrends is still perfectly valid. Too many new traders attempt to “sell the top,” being in at the very beginning of a new downtrend, or “buy the bottom,” being in at the very beginning of a new uptrend. This is an extremely expensive way to learn how to trade! Knowing now that trends can last for much bigger moves than you may have thought previously, hopefully, will help keep you from trying to pick the reversal point. Stick with the basic easy rules and the pips should come! Maybe hundreds more than you were expecting when you first entered that trade…
Until next time,
Rick Wright
Source:: Are the Current Forex Moves Too Big?