Previous Story
Are You Adding Complexity or Simplicity to Your Forex Trading?

Hello traders! Over my last 18 years of trading, and my last 9 years of teaching with Online Trading Academy, there has been a very consistent theme I’ve heard and seen from newer traders. That is, “It can’t be that simple.” This week’s newsletter will show how new/unsuccessful traders seem to want to add complexity to their charts, while experienced/profitable traders choose to add simplicity.
One of my “hobbies,” you could say, is to compare and apply concepts from successful people to my own life, especially in the world of trading! A prime example is Michael Jordan whose said, “I’ve failed over and over and over again in my life and that is why I succeed.” Also, “I can accept failure, everyone fails at something. But I can’t accept not trying.” If one of, if not the greatest basketball players in the history of the game admits to not being perfect but that working hard and improving is the key to success, I think I’ll listen to him!
This week’s newsletter refers to a different famous person and one of my favorite ideas in trading. Colin Chapman is a famous British engineer and the founder of the Lotus sports car company. He once said, “Adding power makes you faster on the straights. Subtracting weight makes you faster everywhere.” This phrase was slightly changed to “add lightness.” What does that really mean? Instead of only concentrating on making a bigger, faster car, he wanted to make his lighter which translated to an overall more effective race car.
In trading, and the classes that I teach, I prefer to “add simplicity.” When a new student who has been trading for a while talks to me about what their charts look like, very often I can see that they have become very good at “adding complexity” which has obviously not translated to big profits! If they were thrilled with the amount of money they were making, they probably wouldn’t be spending a week in a class to learn how to trade! So what does adding complexity mean in trading?
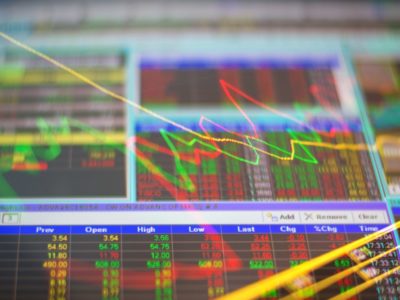
In the following chart, which is nearly identical to what a recent student showed me, is the added complexity.
This student, let’s call him Carl, decided to add a bunch of indicators and oscillators to his charts because someone somewhere on the internet said they were good. As Carl continued to add complexity, he was becoming more and more frustrated in his trading as he was looking for the perfect combination of indicator confluence to place his trades. This is very common! We call it the “Holy Grail” syndrome. “If I can just find the perfect combination of indicators I’ll make a lot of money trading and never be wrong again!” Anyone out there do this as well? I bet many of you have. Carl’s main problem with this is that he had no idea what these extra tools were originally designed for, and therefore didn’t know how to use them properly. Some are for trending markets, some sideways, some you must adjust based on up or down trends, etc. If you are using the wrong tool for the job success is difficult to come by!
While I appreciate Carl’s determination, (see Michael Jordan’s quotes above) he was making his charts more complex yet not adding any extra performance to his trading. In fact, he was trading worse! This should have been obvious if he was tracking his own performance and noting if he was making more or less money every time he added a new tool to his charts. He wasn’t doing this; he didn’t feel the need to because he was an “experienced trader” and “trade journals are for newbies.” Believe me, I laughed when he said that! If you aren’t making money in trading or if you just added some tool to your charts, you MUST keep a journal to see if it is helping! You may not rely on your memory, it must be tracked. If you don’t, I have no sympathy for you when your profit and loss statement is full of red trades. Adding complexity without profitability means you are doing it wrong!
Using our proven supply and demand zones I showed Carl how simple charts could really be, yet still be very effective in trading. Again, most experienced traders who come to class don’t believe it can be this simple. As a reminder, we are looking to see where institutions have a stack of unfilled buy or sell orders waiting to be filled. An imbalance in our supply and demand equation at specific price levels is what makes price turn, NOT a MACD crossover or Stochastics being overbought or oversold! Price action is first, everything else lags. Waiting on a “signal” from these indicators/oscillators usually makes you late to a trade causing your reward to risk ratio to be skewed.
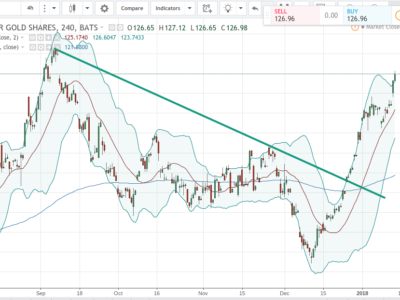
This is an example of a chart with supply and demand properly marked (yes, there are a few smaller levels in there which I didn’t mark.)

Can you see how simple or “light” this chart is? By adding simplicity you will probably add profitability to your profit and loss statements! In addition to taking fewer trades, you will probably be taking fewer losses by avoiding the bad ones.
So what did we learn this week? By adding simplicity to charts most traders will avoid taking many more losses which can add frustration and a lack of profitability. Anytime you choose to add complexity, make sure it is adding to your profitability by journaling your results from using this new tool. If it doesn’t help you make more money, get rid of it! Add lightness to your charts!
Until next time,
Rick Wright
rwright@tradingacademy.com
Source:: Are You Adding Complexity or Simplicity to Your Forex Trading?