Previous Story
Bitcoin Elliott Wave analysis for 21/02/2019
Technical market overview:
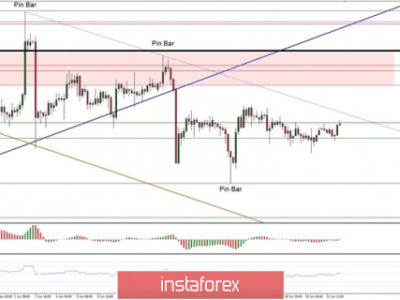
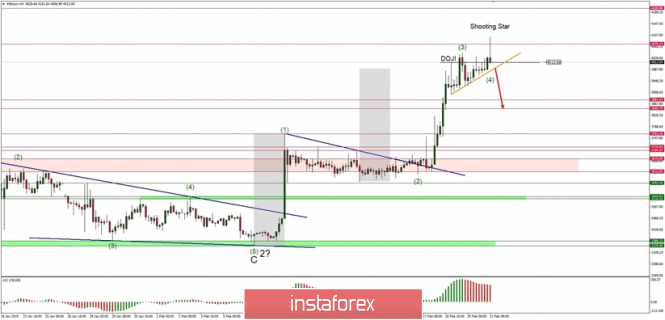
The BTC/USD pair has made a new local higher high at the level of $4,101, but now it looks like the price is starting a local pull-back towards the technical support at the level of $3,881 or $3,850. The price has made a possible Shooting Star candlestick pattern and is now reversing towards the narrow consolidation zone. The short-term trend line, marked in orange, is not the key dynamic support level that will confirm the possibility of a top: any breakout below this level would mean the top should be in place and the corrective cycle has been started.
Traders should now keep an eye at the level of $3,763 as any violation of this level will invalidate the impulsive bullish count and will confirm the top is in place.
Weekly Pivot Points:
WR3 – $3,888
WR2 – $3,820
WR1 – $3,733
Weekly Pivot – $3,657
WS1 – $3,568
WS2 – $3,499
WS3 – $3,414
Trading recommendations:
Currently, going short is not a really good setup and it is better to wait for the price reaction at the level of $3,881 or $3,850 and then open a trade, but if you are an aggressive trader, you can try to short the BTC after the orange trend line is violated (around the level of $3,990 and set the take profit order at one of the nearest technical support levels.
The material has been provided by InstaForex Company – www.instaforex.com