
Previous Story
Buyers appear to be weak around 4hr demand, will a break lower be seen?
Posted On 17 Jun 2014
Comment: 0
For the readers’ benefit:
Price action confirmation: simply means traders will likely wait for price action to confirm a level by consuming the opposing supply or demand area, then entering a trade on a possible retracement, this may occur on the lower timeframes also.
Pending orders: means pending orders are likely seen.
EUR/USD:
4hr TF.
A quick recap of the higher timeframes shows price is currently trading within weekly demand seen at 1.34770-1.36771 and daily demand at 1.34770-1.35557. However, Price action on both of these timeframes do not appear to be showing bullish intentions at the moment.
It was mentioned in Monday’s analysis that the 4hr demand area seen at 1.35036-1.35312 should not be totally ruled out due to price being in higher-timeframe demand (levels above). It was also reported that a spike below may be seen towards the round number 1.35000, before higher prices are likely seen.
The buy pending order that was initially active at 1.35378 has now been closed at breakeven, due to the choppy price action currently being seen. A confirmation buy order has been placed there instead. For this area to be confirmed the buyers will have to consume most of the sellers around the high 1.35791 (marked with an arrow), a pending order will then be permitted to be set at 1.35378 awaiting a possible retracement.
Pending/P.A confirmation orders:
- Pending buy orders (Green line) are seen around demand (1.33995-1.34298) at 1.34368. This demand area will more than likely see some sort of reaction due to its location seen to the left.
- The P.A confirmation sell order (Red line) set at 1.35378 just above demand at 1.35036-1.35312 is now active, a confirmation order has been used here in place of a pending order because of the choppy price action currently being seen within demand (levels above), For this area to be confirmed the buyers will have to consume most of the sellers around the high (marked with an arrow) 1.35791, a pending order will then be permitted to be set at 1.35378 awaiting a possible retracement.
- Pending sell orders (Green line) seen at 1.36955 just below supply at 1.37235-1.37005 are set here since this level remains untouched, meaning unfilled orders are likely still set around this area.
- P.A confirmation sell orders (Red line) are visible below the minor resistance 1.36666 at 1.36625, this level has proved valid, but still needs to be confirmed due to a spike/wick (circled) seen above resistance, which may have consumed most of the sellers originally there. Do be on your guard with these sell orders; the higher-timeframes are indicating that higher prices may be seen this week.
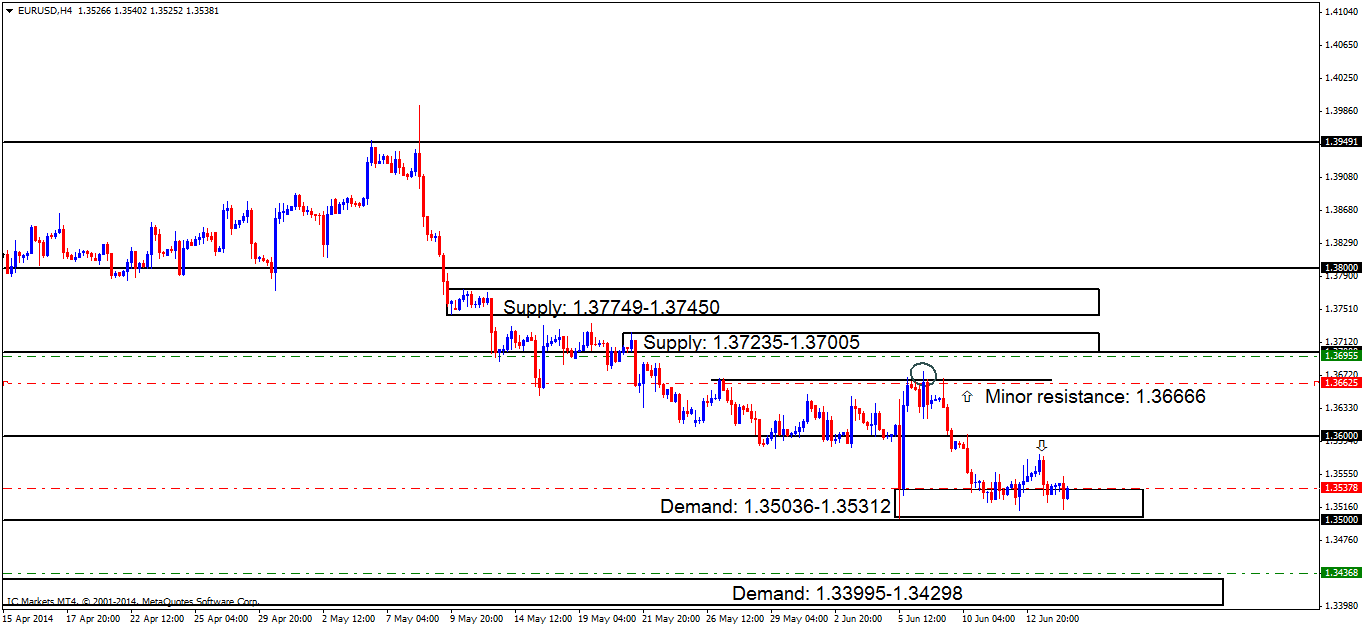
- Areas to watch for buy orders: P.O: 1.34368 (SL: 1.33926 TP: Dependent on how price action approaches the zone). P.A.C: (Active-awaiting confirmation) 1.35378 (SL: likely to be set at 1.34971 TP: [1] 1.36000 [2] 1.36666 [may be subject to change depending on approaching price action]).
- Areas to watch for sell orders: P.O: 1.36955 (SL: 1.37270 TP: [1] 1.36666 [2] 1.36000) P.A.C: 1.36625 (SL: 1.36810 TP: Dependent on where price ‘confirms’ the level).
- Most likely scenario: Much the same as yesterday’s analysis, the demand area at 1.35036-1.35312 will likely still see more of a bullish reaction than it currently is, nevertheless, a spike lower may be seen to the round number at 1.35000 before higher prices are seen, hence the need to close our pending order at 1.35378 as we run the risk of getting stopped out, if a spike through demand (levels above) to the round number 1.35000 does indeed happen.
GBP/USD:
Daily TF.
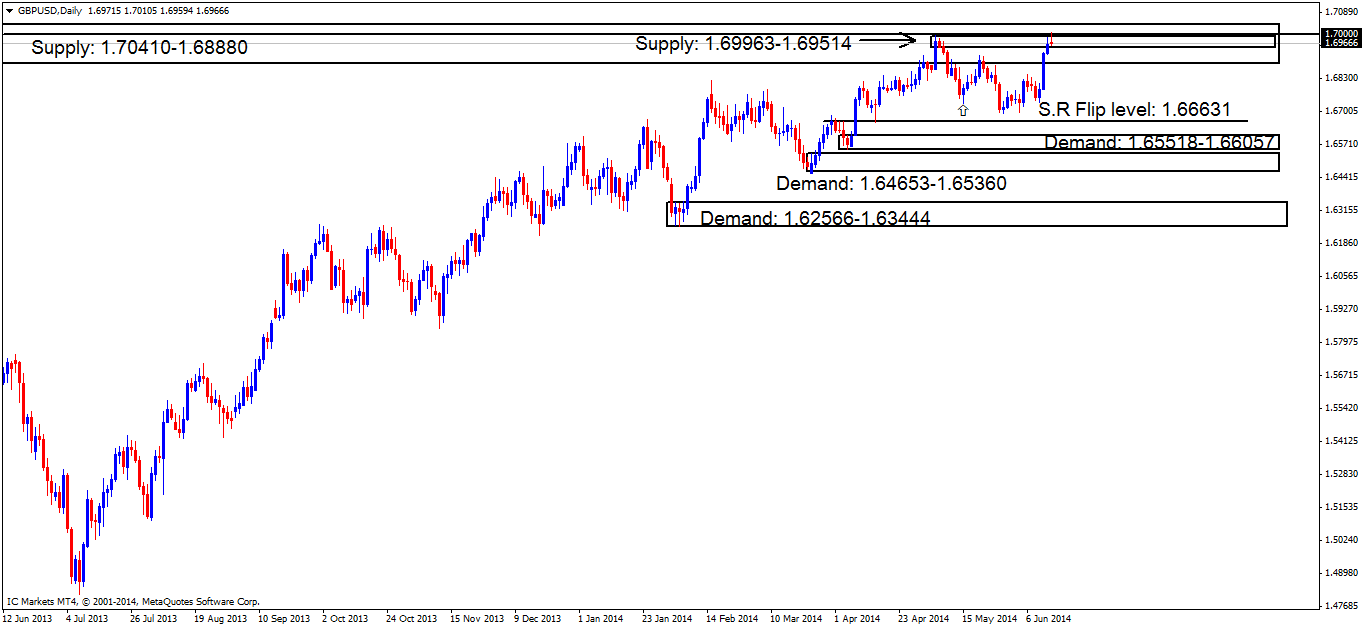
It is always a good idea to be reminded of what the higher timeframes are up to. The daily timeframe currently shows price reacting within the overall larger daily supply area at 1.70410-1.68880, and just ever so slightly consuming minor daily supply within at 1.69963-1.69514.
If a break above is seen, price will likely trade up to the next supply area at 1.76290-1.73110 deep within weekly supply at 1.76290-1.70490 (not seen on the chart below).
4hr TF.
This is the reason we set confirmation orders at areas we are not sure of! Look at that beautiful spike/wick firstly through supply at 1.69963-1.69726, and then straight through the round number just above at 1.70000.
This was pro money likely at work here, imagine, for a moment, how many sellers’ stops were set just above this round number (1.70000), and also how many breakout buyers’ buy orders were triggered here! This is exactly what pro money needs, they need liquidity, and they got it here in the form of buy orders for them to sell into.
Pending/P.A confirmation orders:
- Pending buy orders (Green line) are seen just above the round number 1.67000 at 1.67043, this area will likely see a reaction due to the amount of credible touches this level has seen, making it an area to watch out for.
- Pending buy orders (Green line) are seen at 1.67610 just above demand at 1.67378-1.67583. A pending order is valid here due to the momentum away from the demand area, indicating orders may be left unfilled here.
- P.A confirmation buy orders (Red line) are seen just above the round number 1.68000 at 1.68038. A reaction may be likely here because of the way pro money used this level to rally prices higher with force, a quick change in direction like this likely indicates pro money activity, thus, all of their orders may have not been filled at that time. The reason a pending order is not used here is because pro money, on a regular basis perform deep stop hunts around big figure levels (1.68000), and these tails/wicks can be huge sometimes, hence the need to wait for confirmation.
- No pending sell orders (green line) are seen in the current market environment.
- The P.A confirmation sell orders (Red line) set at 1.69696 just below supply at 1.69963-1.69726 is now active. Price will need to convincingly consume buyers around the low (marked with an arrow) at 1.69221 below before a pending order is permitted.

- Areas to watch for buy orders: P.O: 1.67043 (SL: 1.66527 TP: [1] 1.68000 [3] 1.68708) 1.67610 (SL: 1.67345 TP: [1] 1.68000 [2] 1.69000 [likely to be changed, depending on price approach]). P.A.C: 1.68038 (SL: Dependent on where price ‘confirms’ the level TP: Dependent on where price ‘confirms’ the level).
- Areas to watch for sell orders: P.O: No pending sell orders seen in the current market environment. P.A.C: (Active-awaiting confirmation) 1.69696 (SL: More than likely will be at 1.70030 TP: Dependent on where price ‘confirms’ the level).
- Most likely scenario: Price will likely begin seeing a decline in value as a lot of traders are no doubt taking profit around this psychological number 1.70000 from the rally in price last week. Price will likely see a drop to at least the very last ‘mini’ low 1.69221 (marked with an arrow) seen on this timeframe, before the next ‘decision’ is made.
AUD/USD:
Weekly TF.
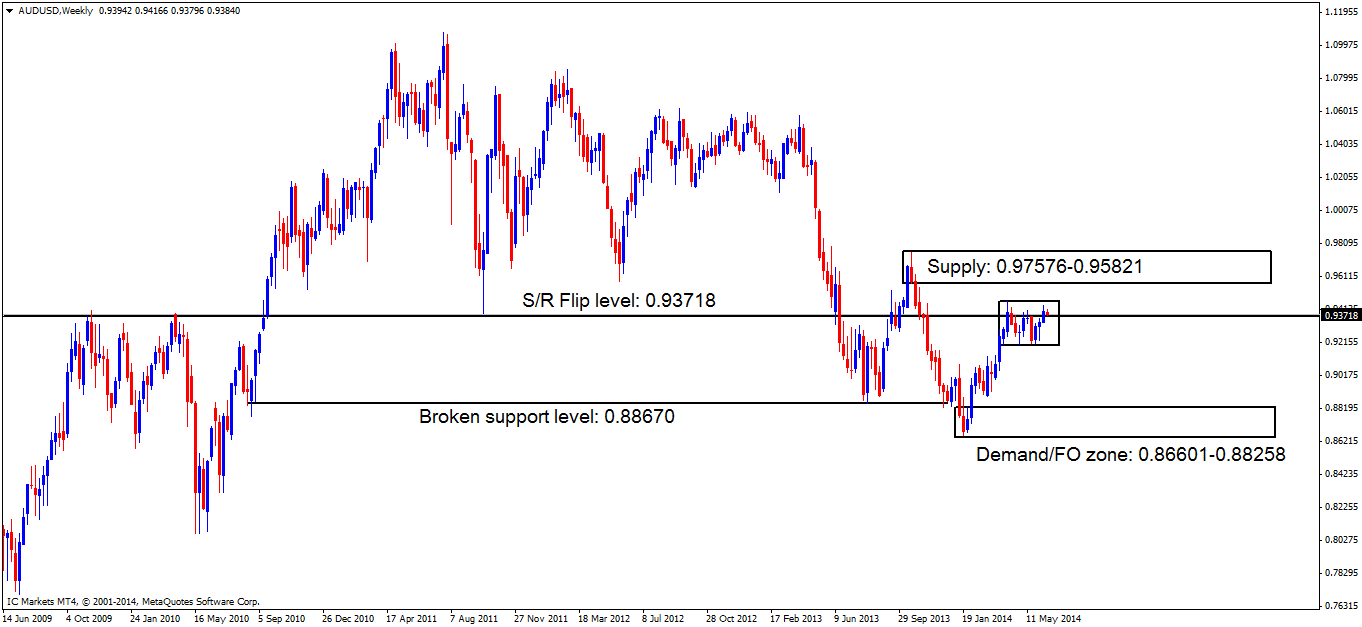
A quick reminder of the weekly timeframe, price is currently seen consolidating around the S/R flip level 0.93718, with a positive break in either direction yet to be seen.
Daily TF.
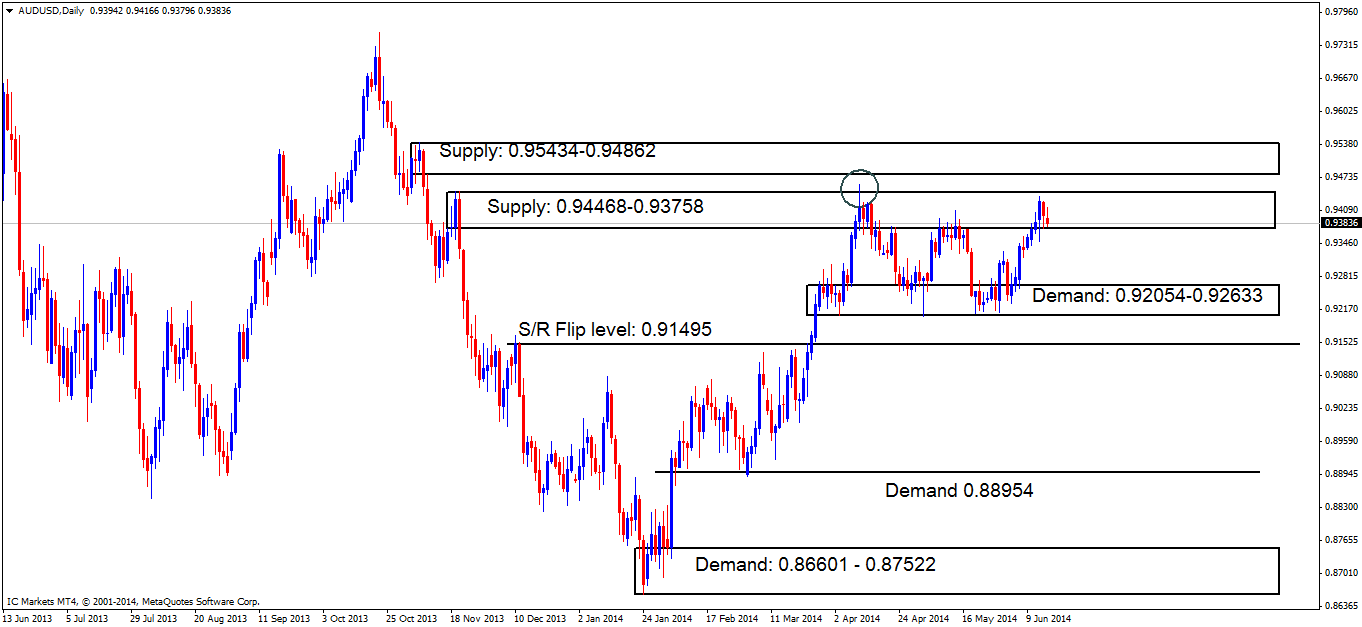
The sellers are starting to show some interest within daily supply at 0.94468-0.93758, nonetheless, how long this interest may last is difficult to tell, as this supply area appears to have been weakened by the wick/spike (circled), that likely consumed most the sellers in and around this area as explained in yesterday’s analysis.
4hr TF.
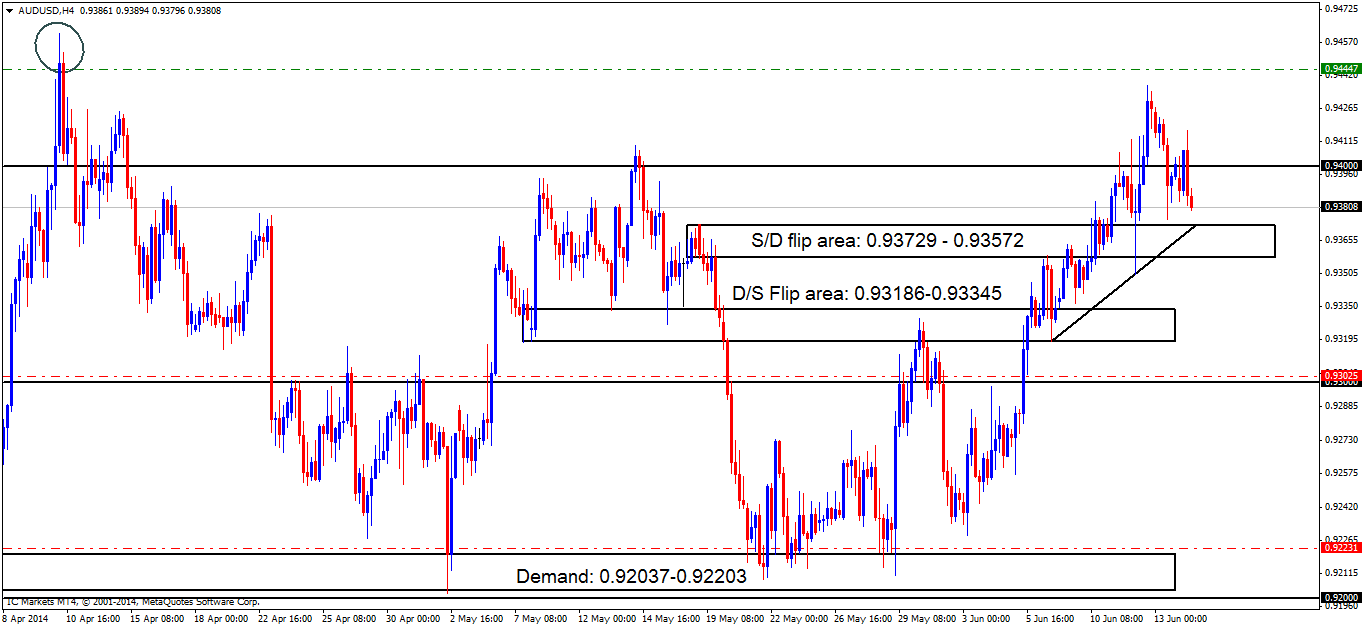
Technically, not much has changed since the last analysis; price has been seen dancing in and around the round number at 0.94000, no doubt creating frustration with the lower-timeframe traders seeing stops taken from both buyers and sellers.
The mini trend line is not attached to represent a trend as such; it is more to show how pro money has likely been consuming small demand pockets while price is still rallying. Price appears relatively free to drop down to at least the round number 0.93000, as there is no ‘obvious’ fresh demand areas seen on this timeframe.
Taking all of the above into consideration, pro money may require more buy orders to push price down to the round number just mentioned above, so, a rally to the highs may be seen beforehand at 0.94613 (circled), this will entice momentum buyers to follow price on the lower timeframes, thus giving pro money enough orders to possibly sell right into!
- No pending buy orders (Green line) are seen in the current market environment.
- P.A confirmation buy orders (Red line) are seen at 0.92231 just above demand at 0.92037-0.92203. It would be too risky to set a pending order around this area, since deep spikes into this demand zone have been seen (levels above) possibly consuming the majority of buyers in the process.
- P.A confirmation buy orders (Red line) are visible just above the round number 0.93000 at 0.93025. We require confirmation of this level because previous price action has warned us deep tests both north and south happen on a regular basis, hence the need to wait for confirmation rather than getting stopped out time after time through lack of patience
- Pending sell orders (Green line) are seen at 0.94447, if price manages to get up to this level, active sellers are likely waiting because of how quickly price changed in direction, only pro money have the account size to do this, indicating unfilled sell orders may still be unfilled there.
- No P.A confirmation sell orders (Red line) are seen in the current market environment.
- Areas to watch for buy orders: P.O: No pending orders are seen with current price action. P.A.C: 0.92231 (SL: more than likely will be at 0.91984 TP: Decided if/when price ‘confirms’ the level) 0.93025 (SL: Dependent on where price ‘confirms’ the level TP: Dependent on where price ‘confirms’ the level).
- Areas to watch for sell orders: P.O: 0.94447 (SL: 0.94667 TP: Dependent on how price action approaches the area). P.A.C: No P.A confirmation sell orders seen in the current market environment.
- Most likely scenario: It is very unlikely price will rally back up to the highs at 0.94613 as we are in Weekly and Daily higher-timeframe supply (0.93718/0.94468-0.93758). During the week we will likely see a decline to the round number 0.93000 below, as most of the demand areas visible on this timeframe have been consumed.
USD/JPY:
4hr TF.
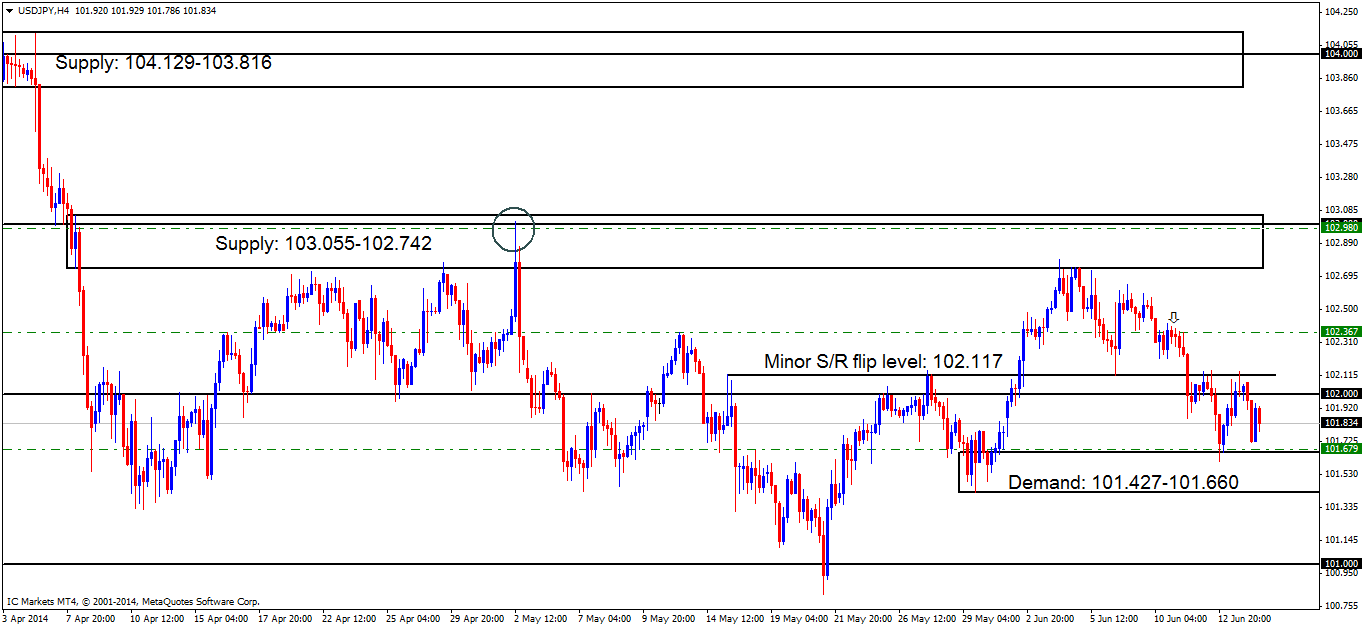
The higher timeframes as currently showing price trading around demand (Weekly: 101.254, Daily: 101.532-100.787) so higher prices are naturally expected sometime this week.
It was reported in yesterday’s analysis that price would likely see a decline in value, and that a push down into demand at 101.427-101.660 was not out of the question. A push down was seen yesterday, nearly hitting our pending order entry at 101.679.
The pending order set (101.679), has already hit the first target (see below), the position will remain active until we are either stopped out, or our second target is hit, but do bear in mind this may change, if the market suggests so.
- Pending buy orders (Green line) are seen just above demand (101.427-101.660) at 101.679 is now active. The first target has been hit at 102.000.
- No P.A confirmation buy orders (red line) are seen in the current market environment.
- Pending sell orders (Green line) are visible at 102.980, deep within supply (103.055-102.742), this area may well appear to be weak now, but the way price reacted at the circled area within supply indicates pro money activity, meaning sell orders may be left unfilled there, so a pending order is permitted.
- Near-term pending sell orders (Green line) are seen at 102.367. A pending order is valid here since this is the area where pro money made the ‘decision’ to take prices lower into demand (101.427-101.660), unfilled sell orders were likely left there in the process.
- No P.A confirmation sell orders (Red line) are seen in the current market environment.
- Areas to watch for buy orders: P.O: (Active – 1st target hit) 101.679 (SL: 101.404 TP: [1] 102.000 [2] 102.367 [but may be subject to change]) P.A.C: No P.A confirmation buy orders seen in the current market environment.
- Areas to watch for sell orders: P.O: 102.980 (SL: 103.108 TP: 102.117, but may well change if the market sees any new developments) 102.367 (SL: 102.458 TP: Dependent on how price action approaches this area). P.A.C: No P.A confirmation sell orders seen in the current market environment.
- Most likely scenario: Price will likely decline a little further into 4hr demand at 101.427-101.660 before any rally north is seen, since the higher timeframes are currently showing price trading around demand (Weekly: 101.254 Daily: 101.532-100.787), so higher prices are naturally expected sometime this week.
EUR/GBP:
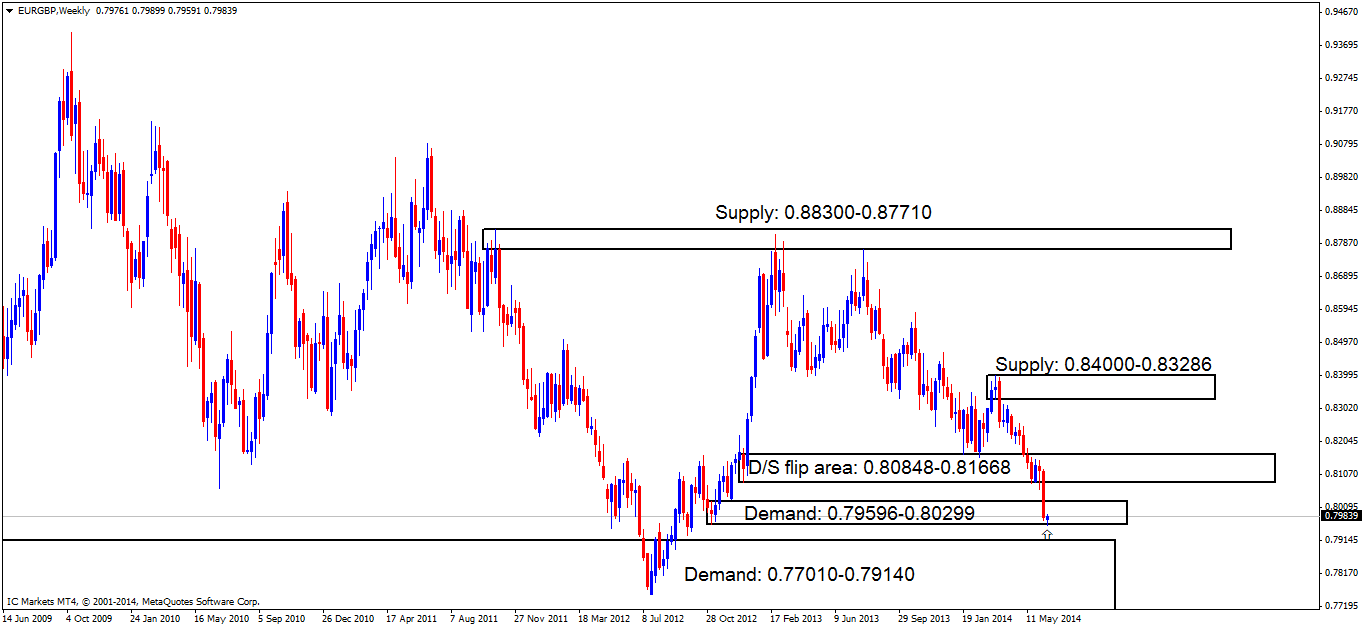
Weekly TF.
The weekly timeframe shows buyers are beginning to show some interest deep within weekly demand at 0.79596-0.80299. At the time of writing price has spiked below this demand area (marked with an arrow), no doubt consuming some of the buyers’ stops here. Is this a fakeout, or is this a signal price is going lower?
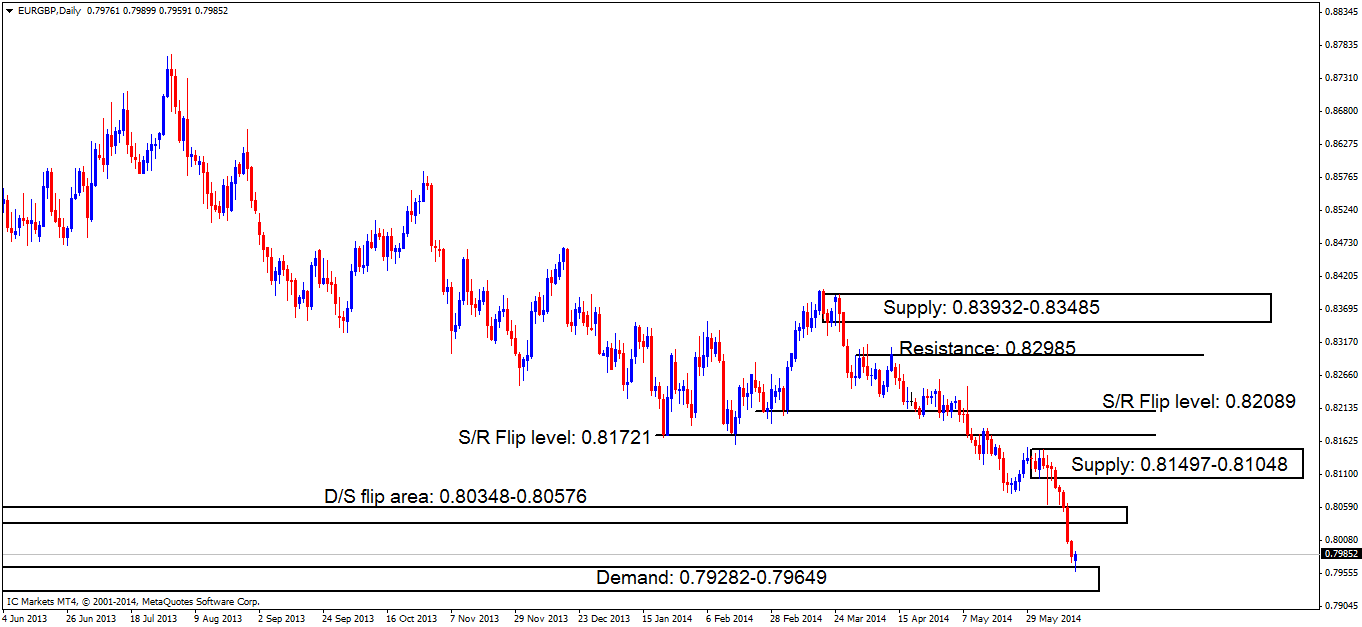
Daily TF.
That is so beautiful, notice how this small spike below weekly demand (levels above) traded right into a daily demand area seen at 0.79282-0.79649. A positive daily close below this demand area could be devastating for the buyers as there is very little stopping price from dropping all the way down to major support below at 0.77533 (not shown on the chart).
4hr TF.
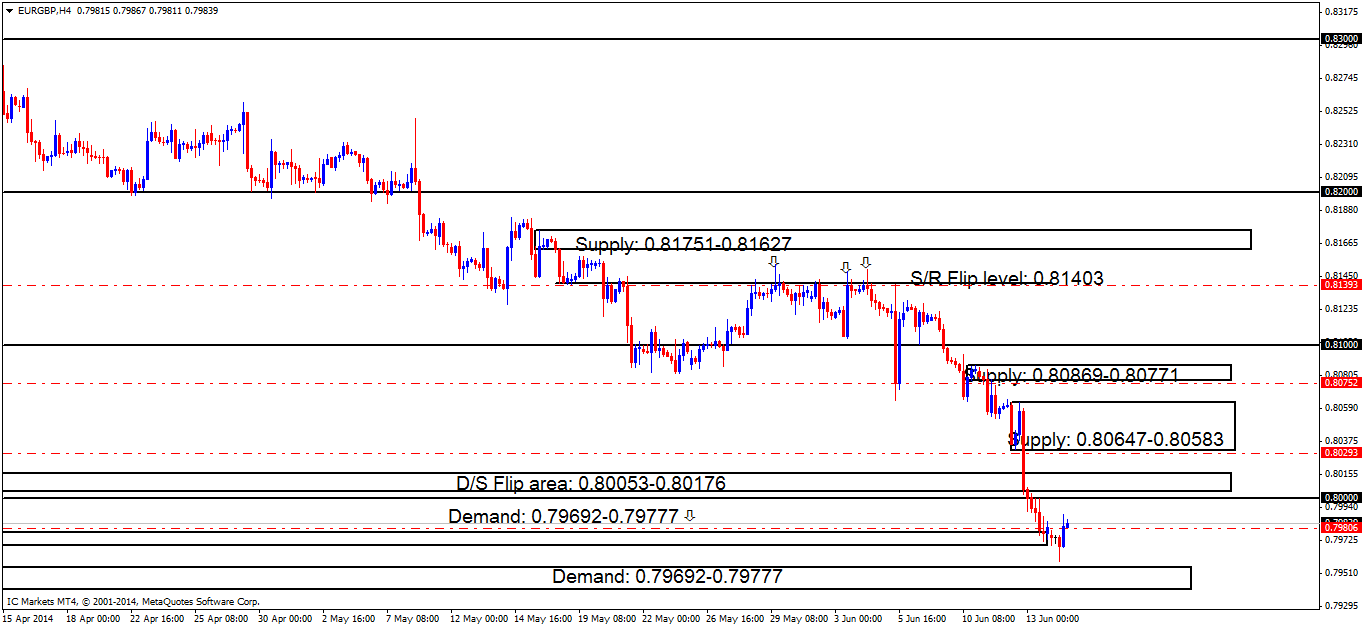
Chart 1 below shows price has consumed demand at 0.79692-0.79777 cancelling out our confirmation buy order at 0.79806 with price seen making an attempt to touch base with demand below at 0.79405-0.79552.
Chart 1:
- No pending buy orders (Green line) are seen in the current market environment.
- The P.A confirmation buy order (Red line) set just above demand (0.79692-0.79777) at 0.79806 has been cancelled (seen above on chart 1). Price dropped too far below the entry level and the buyers made no attempt to confirm the level by consuming sellers at the D/S flip area (0.80053-0.80176).
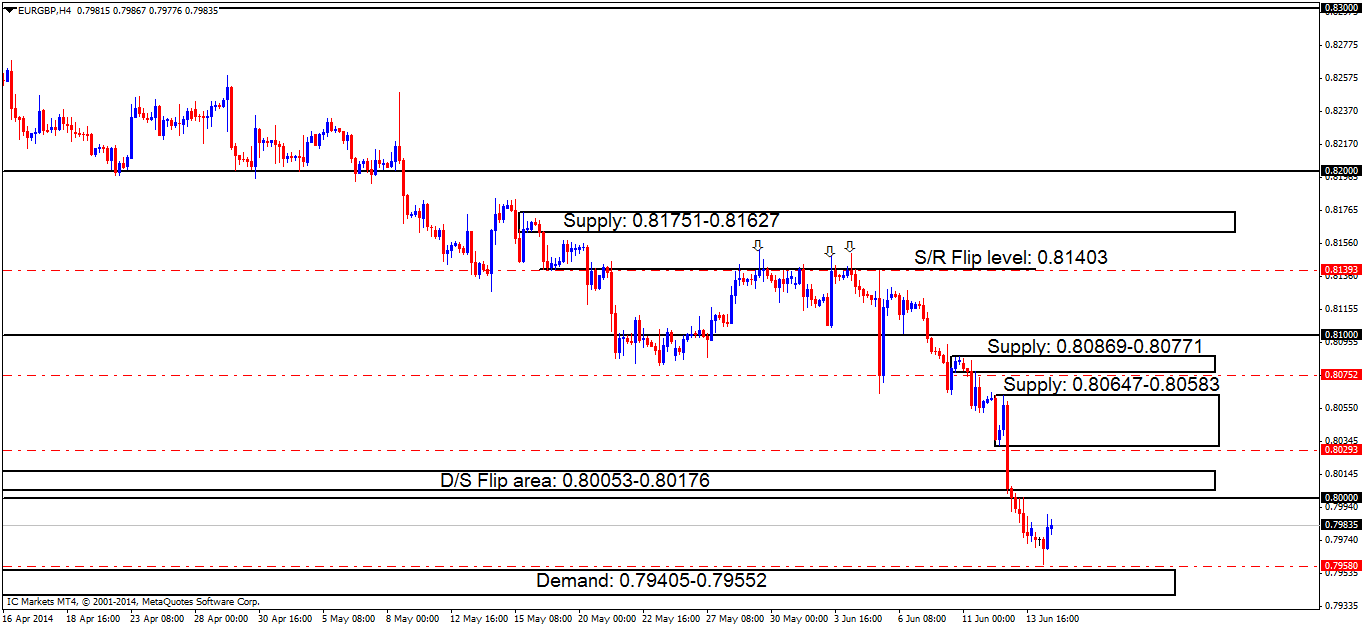
- A new confirmation buy order (Red line) set just above demand (0.79405-0.79552) at 0.79580 is now active. Buyers will need to confirm this level by consuming sellers at the D/S flip area (0.80053-0.80176); a pending order can then be set at 0.79580 awaiting a possible retracement.
- No pending sell orders (Green line) are seen in the current market environment.
- P.A confirmation sell orders (Red line) under the S/R flip level 0.81403 at 0.81393 is an area where a reaction is likely, however there were too many wicks north seen marked with arrows, indicating sellers are drying up, thus, the need to wait for more confirmation.
- P.A confirmation sell orders (Red line) are seen just under supply (0.80869-0.80771) at 0.80752. Confirmation orders were used here because price is trading around a weekly demand area (0.79596-0.80299), which means price could easily consume this supply level as the higher timeframes usually overrule the lower timeframes.
- P.A confirmation sell orders (Red line) are seen just below supply (0.80647-0.80583) at 0.80293. Confirmation orders were used here because price could easily consume this supply level as we are currently deep within a weekly demand area (0.79596-0.80299), which means price could easily consume this supply level as the higher timeframes usually overrule the lower timeframes.
Chart 2 below shows the alterations that have been made; a confirmation buy order has been set above demand (0.79405-0.79552) at 0.79580. This is a particularly good area due to the higher timeframes also being seen in demand (levels above).
Chart 2:
- Areas to watch for buy orders: P.O: No pending buy orders seen in the current market environment.
- P.A.C: (Active – awaiting confirmation) 0.79580 (SL: Dependent on where price ‘confirms’ the level TP: Dependent on where price ‘confirms’ the level).
- Areas to watch for sell orders: P.O: No pending sell orders seen in the current market environment. P.A.C: 0.81393 (SL: Will be likely set at 0.81564 TP: Will be likely set at the round number 0.81000) 0.80752 (SL: likely to be set at 0.80900 TP: Dependent on where price ‘confirms’ the level) 0.80293 (SL: likely to be set at 0.80648 TP: Dependent on where price ‘confirms’ the level).
- Most likely scenario: Due to price being seen in higher timeframe demand on the weekly (0.79596-0.80299) and daily (0.79282-0.79649), a rally to at least the D/S flip area above at 0.80053-0.80176 will likely be seen.
USD/CAD:
4hr TF.
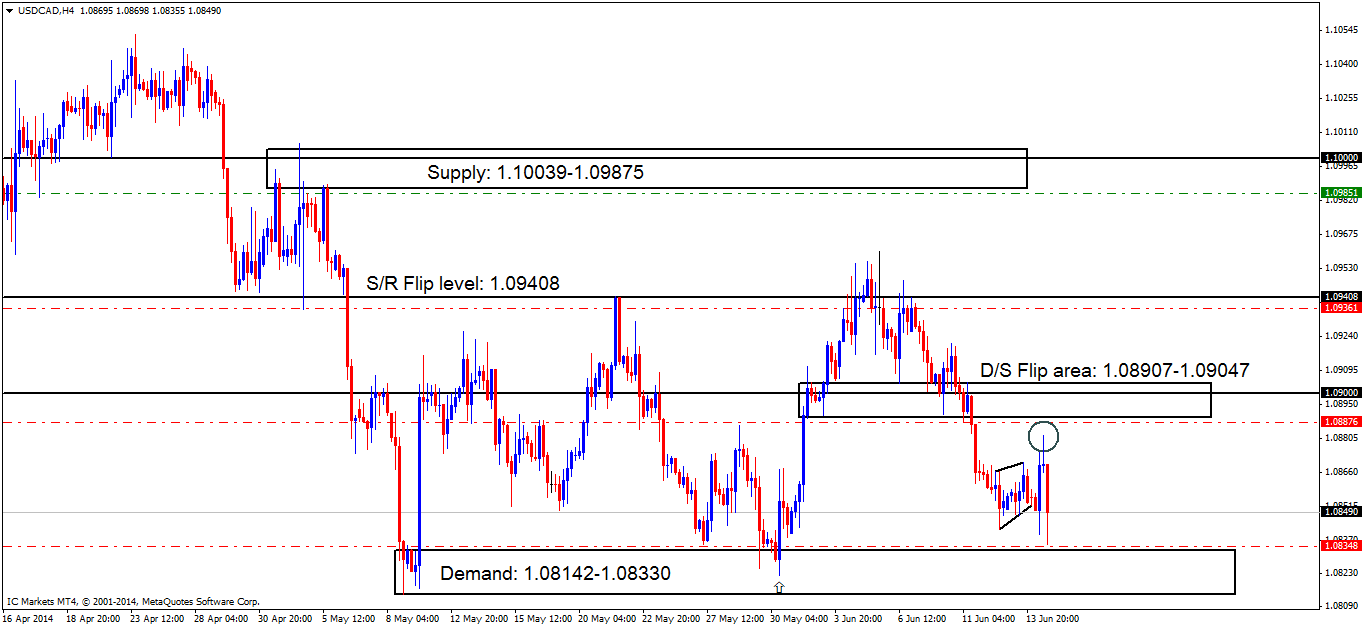
A bearish flag seems to have formed on the 4hr timeframe, a fakeout south was first seen, this no doubt stopped a lot of traders out on the lower timeframes going long around temporary support at 1.08417.
Pro money was not satisfied with this, as they faked price north above bearish flag (marked with a circle) as well, causing stress and confusion for the less-informed retail and hedge fund traders, with price finally dropping down near to demand, just missing our P.A confirmation order set at 1.08348 by a pip or two!
Price still remains capped between supply at 1.08907-1.09047 and demand below at 1.08142-1.08330.
- No pending buy orders (Green line) are seen in the current market environment.
- P.A confirmation buy orders (Red line) seen just above demand (1.08142-1.08330) at 1.08348. There may be orders left unfilled here, however, a pending order is not wise due to how deep price penetrated the level before (marked with an arrow).
- Pending sell orders (Green line) just below supply (1.10039-1.09875) at 1.09851 will very likely see a nice reaction. However, we should remain aware of the big figure number 1.10000 lurking within the top half of the supply area (levels above), so a bigger stop may be necessary.
- P.A confirmation sell orders (Red line) are seen just below the S/R flip level (1.09408) at 1.09361. A P.A.C order was selected here because of the deep wicks seen in and around this area, possibly indicating sellers have been consumed, thus weakening the level on return.
- P.A confirmation sell orders (Red line) are seen just below the D/S flip area (1.08907-1.09047) at 1.08876. Pending orders are not logical here since price could very well spike north, deep into the zone, attempting to penetrate the round number 1.09000 which could possibly stop us out if we had pending orders set.
- Areas to watch for buy orders: P.O: There are no pending buy orders seen in the current market environment. P.A.C: 1.08348 (SL: Likely to be set at 1.08127 TP: Decided if/when price ‘confirms’ the level).
- Areas to watch for sell orders: P.O: 1.09851 (SL: 1.10114 TP: [1] 1.09408 [2] 1.09047) P.A.C: 1.09361 (SL likely to be set at 1.09513 TP Decided if/when price ‘confirms’ the level) 0.08876 (SL: Decided if/when price ‘confirms’ the level TP: Decided if/when price ‘confirms’ the level).
- Most likely scenario: Price will likely trade deeper within demand seen below at 1.08142-1.08330 sometime today before any higher prices are seen.
USD/CHF:
4hr TF.
In the last analysis it was reported that:
Price worryingly closed at the end week, just above the huge round number 0.90000 at 0.90012. Ideally, we wanted to see price react better off of this area, hopefully, today (Monday) will provide us with an answer as to whether this round number will cause us problems or not.
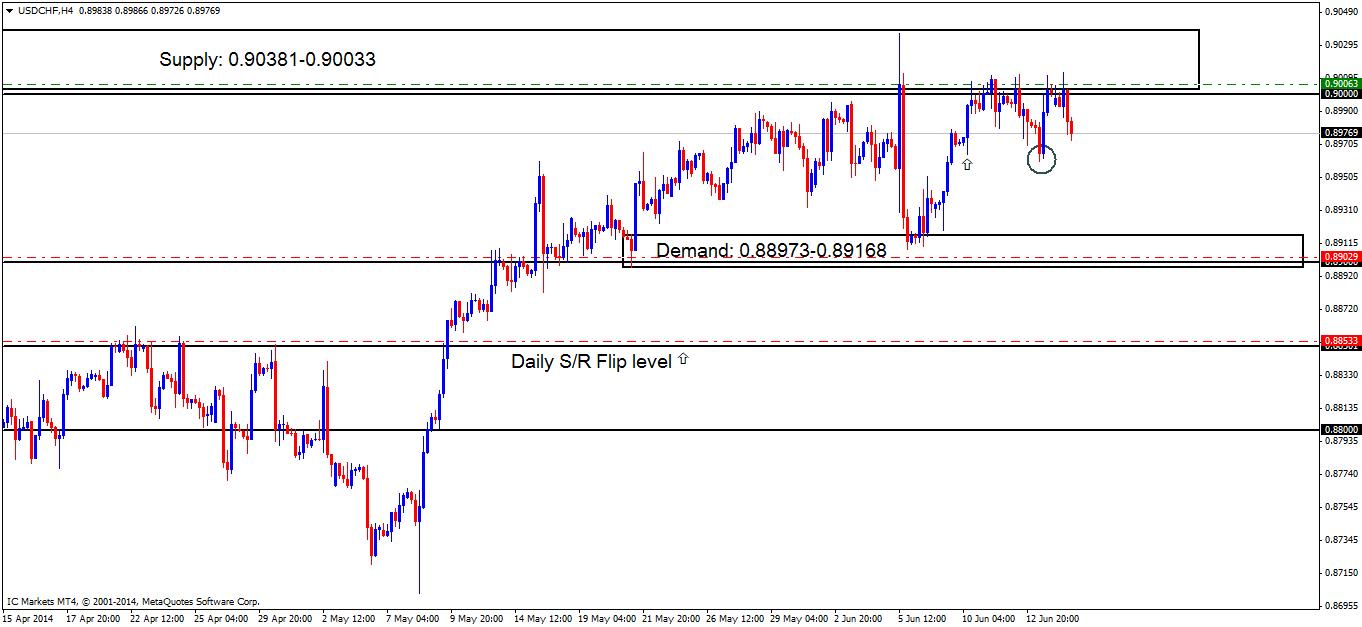
The close above the round number 0.90000 did not cause us any problems, as a decline in price has been seen from supply at 0.90381-0.90033.
As the low marked with an arrow has been consumed (marked with a circle), meaning the majority of the buyers were likely stopped out here, this should theoretically clear the path south for the sellers to at least down to demand at 0.88973-0.89168, where active buyers may be waiting.
- No pending buy orders (Green line) are seen in the current market environment.
- P.A confirmation buy orders (Red line) are seen just above the daily S/R flip level (0.88501) at 0.88533. This level needs to see some confirming price action before any entry is placed in the market, due to their being no logical area for a stop loss order.
- Near-term P.A confirmation buy orders (Red line) are seen within demand (0.88973-0.89168) at 0.89029, just above the round number 0.89000, as price may retrace to demand to collect unfilled orders.
- The pending sell order (Green line) visible at the base of supply (0.90381-0.90033) just above the round number 0.90000 at 0.90063 still remains active, so keep a close eye on the first target area.
- No P.A confirmation sell orders (Red line) are seen in the current market environment.
- Areas to watch for buy orders: P.O: There are no pending buy orders seen in the current market environment. P.A.C: 0.88533 (SL: Decided if/when price ‘confirms’ the level TP: Decided if/when price ‘confirms’ the level) 0.89029 (SL: Likely to be set at 0.88784 TP: Decided if/when price ‘confirms’ the level).
- Areas to watch for sell orders: P.O: (Active) 0.90063 (SL: 0.90412 TP: [1] 0.89168 [2] 0.88501) P.A.C: There are currently no P.A confirmation orders seen in the current market environment.
- Most likely scenario: Sellers will likely attempt to bring prices lower to at least demand at 0.88973-0.89168, as the minor (trouble) demand area at 0.89747 (marked with an arrow) has been consumed (circled).
XAU/USD (GOLD):
Daily TF.
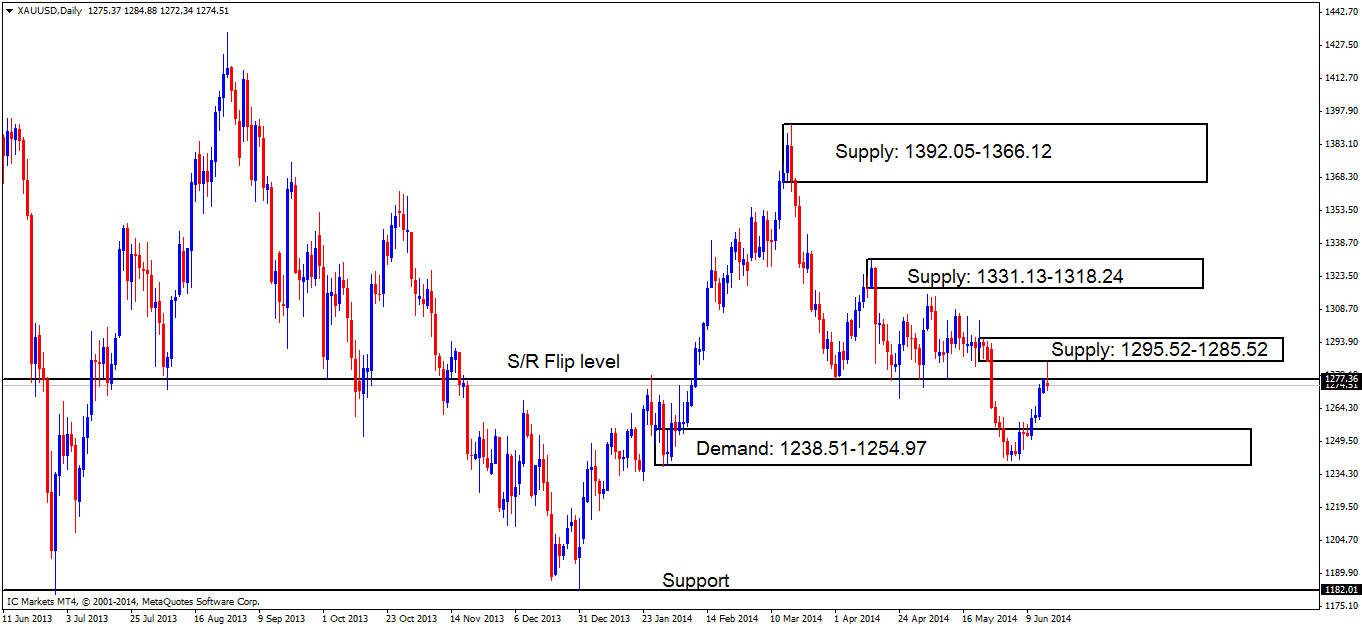
It was reported in the last analysis that price may fakeout above this S/R flip level at 1277.36 into supply at 1295.52-1285.52. This did actually happen, with the sellers seen taking full advantage of the liquidity available around both areas just mentioned, meaning lower prices are likely to be seen very soon.
4hr TF.
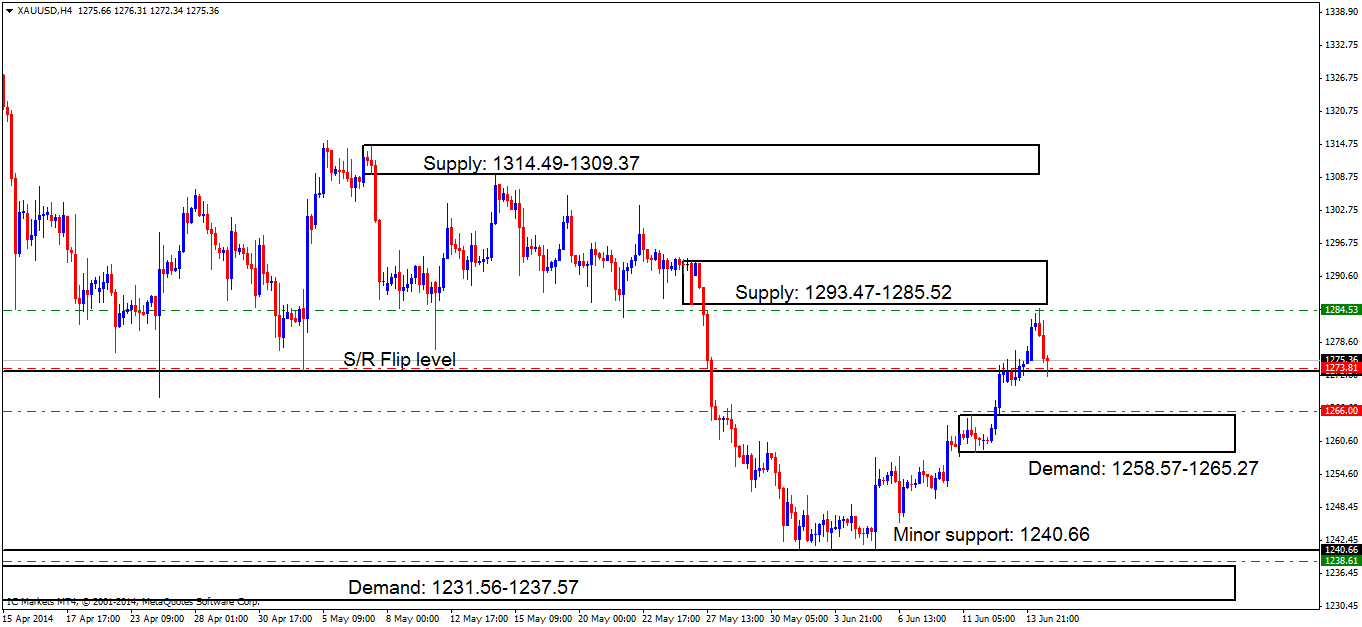
The 4hr timeframe below shows price has reacted off of supply at 1293.47-1285.52 beautifully with very small drawdown seen. The first target has already been hit at the S/R flip level (1273.34), which was also a P.A confirmation buy order that is yet to prove itself.
If price breaks below the S/R flip level (level above), a push lower down to demand at 1258.57-1265.27 is very likely which is target number two for our current short position at 1284.53.
- Pending buy orders (Green line) are seen above demand (1231.56-1237.57) at 1238.61 as pro money will in the future likely fake the minor support level at 1240.66 into demand below (levels above).
- P.A confirmation buy orders (Red line) are seen just above demand (1258.57-1265.27) at 1266.00. A confirmation order is used here for the simple fact price is trading around daily timeframe resistance at 1277.36, and the daily timeframe usually overrules the 4hr timeframe making it very risky indeed to place a pending order here.
- The P.A confirmation buy order (Red line) set just above the S/R flip level (1273.34) at 1273.81 is now active. The buyers will need to confirm this level by consuming sellers within supply at 1293.47-1285.52; a pending order can then be set at 1273.81 awaiting a likely retracement.
- The pending sell order (Green line) set just below supply (1293.47-1285.52) at 1284.53 is now active with price hitting its first target already at 1273.34.
- No P.A confirmation sell orders (Red line) are seen in the current market environment.
- Areas to watch for buy orders: P.O: 1238.61 (SL: 1230.64 TP: Dependent on price approach) P.A.C: 1266.00 (SL: likely to be set at 1257.31 TP: Decided if/when price ‘confirms’ the level) 1273.81 (Active-awaiting confirmation) (SL: Decided if/when price ‘confirms’ the level TP: Decided if/when price ‘confirms’ the level).
- Areas to watch for sell orders: P.O: (Active-1st target hit) 1284.53 (SL: 1294.70 TP: [1] 1273.34 [2] 1268.03 [3] 1240.66) P.A.C: There are currently no P.A confirmation sell orders seen in the current market environment.
- Most likely scenario: Price will likely trade between 4hr supply above at 1293.47-1285.52 and the S/R flip level at 1273.34 during the low-volume sessions, once volatility picks up, price will likely break the S.R flip level (level above) and hit 4hr demand below seen at 1258.57-1265.27.
Source: Tuesday 17th June: Buyers appear to be weak around 4hr demand, will a break lower be seen?


