
Previous Story
Daily analysis of GBP/USD for April 13, 2018
Posted On 13 Apr 2018
Comment: 0
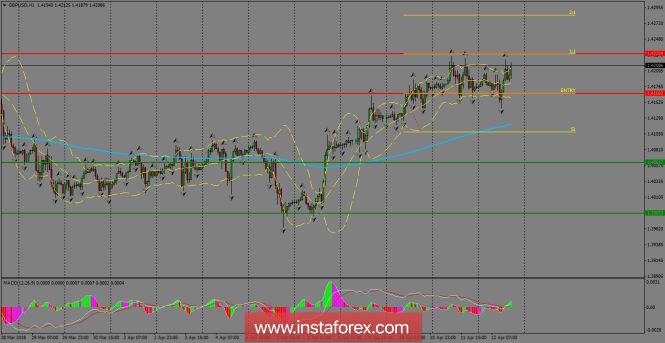
The pair keeps the support level at 1.4166 across the board and it seems we can expect a testing of the resistance area of 1.4225. The bulls are still strong and one breakout above that zone should open the doors for the psychological level of 1.4300. To the downside, if the aforementioned support gives up, then it can plummet to test the 200 SMA in the H1 chart.
H1 chart’s resistance levels: 1.4166 / 1.4225
H1 chart’s support levels: 1.4061 / 1.3985
Trading recommendations for today: Based on the H1 chart, buy (long) orders only if the GBP/USD pair breaks a bullish candlestick; the resistance level is at 1.4166, take profit is at 1.4225 and stop loss is at 1.4108.The material has been provided by InstaForex Company – www.instaforex.com


