
Previous Story
Daily analysis of GBP/USD for April 16, 2018
Posted On 15 Apr 2018
Comment: 0
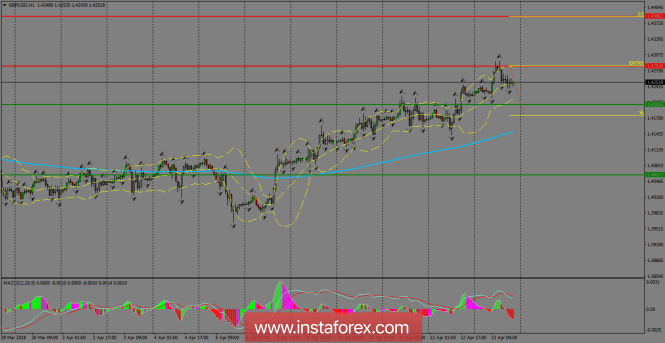
GBP/USD continues with the bullish bias across the board, as it managed to break above 1.4205, which was a key level for the bulls. The nearest resistance lies at 1.4283, where the pair should work with a breakout in order to allow additional gains toward the next key barrier at 1.4386. The 200 SMA at H1 chart remains to guide the path for the short-term.
H1 chart’s resistance levels: 1.4283 / 1.4386
H1 chart’s support levels: 1.4205 / 1.4061
Trading recommendations for today: Based on the H1 chart, buy (long) orders only if the GBP/USD pair breaks a bullish candlestick; the resistance level is at 1.4283, take profit is at 1.4386 and stop loss is at 1.4183.The material has been provided by InstaForex Company – www.instaforex.com


