
Previous Story
Daily analysis of GBP/USD for February 14, 2018
Posted On 14 Feb 2018
Comment: 0
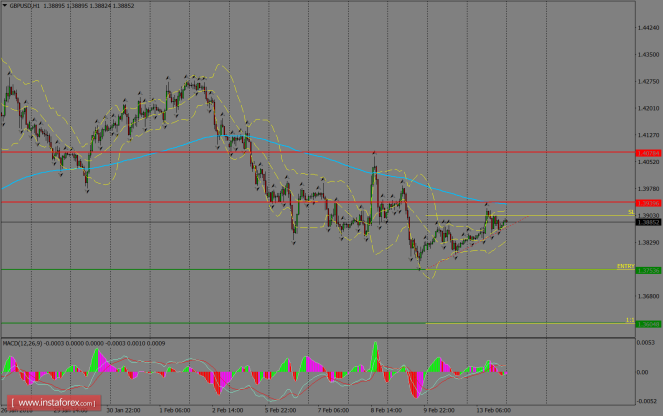
GBP/USD continues to recover above the lows of February 9, and it’s looking to test the 200 SMA at H1 chart. Around that zone, we’re expecting a pullback to take place in order to test the support zone of 1.3753. That level should give up to allow more losses toward the 1.3604 level. MACD indicator remains in the neutral territory, calling for a sideways consolidation.
H1 chart’s resistance levels: 1.3939 / 1.4078
H1 chart’s support levels: 1.3753 / 1.3604
Trading recommendations for today: Based on the H1 chart, sell (short) orders only if the GBP/USD pair breaks a bearish candlestick; the resistance level is at 1.3753, take profit is at 1.3604, and stop loss is at 1.3903.
The material has been provided by InstaForex Company – www.instaforex.com


