
Previous Story
Daily analysis of GBP/USD for February 21, 2018
Posted On 20 Feb 2018
Comment: 0
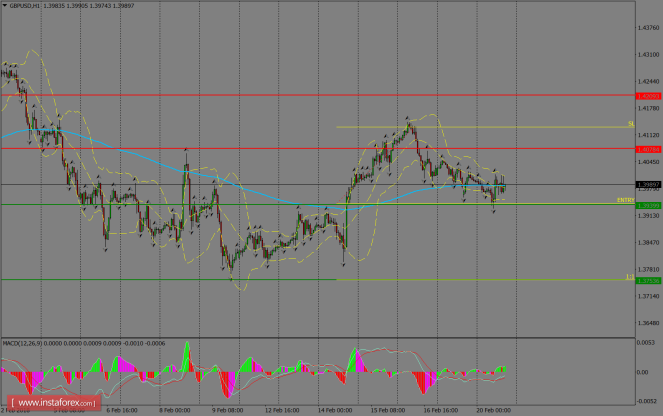
GBP/USD is off from February 16th highs and it’s currently trading around the 200 SMA at the H1 chart, being supported by the 1.3939 level. If such area gives up in favor of the bears, the pair could go to test the 1.3753 level. To the upside, if it manages to break above the 1.4078 level, the next target should be the 1.4209 level. MACD indicator remains in favor of the bulls for the short-term.
H1 chart’s resistance levels: 1.4078 / 1.4209
H1 chart’s support levels: 1.3939 / 1.3753
Trading recommendations for today: Based on the H1 chart, sell (short) orders only if the GBP/USD pair breaks a bearish candlestick; the resistance level is at 1.3939, take profit is at 1.3753 and stop loss is at 1.4130.
The material has been provided by InstaForex Company – www.instaforex.com


