
Previous Story
Daily analysis of GBP/USD for January 03, 2018
Posted On 03 Jan 2018
Comment: 0
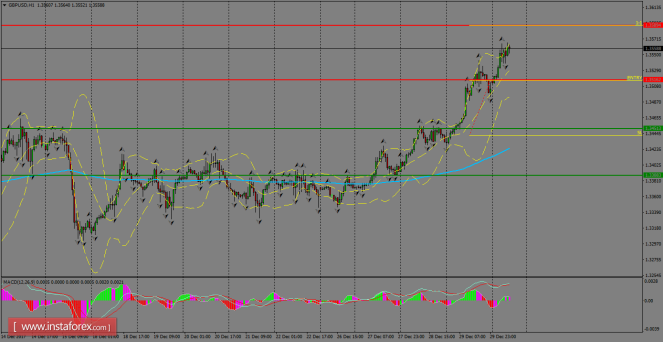
The pair has broken the resistance zone of 1.3516 and it’s targeting now the 1.3589 level, following a higher high pattern formation. The 200 SMA is pointing to the upside and calling for more bullish moves across the board. However, corrective moves could happen in order to erase the overbought conditions showed by the Cable.
H1 chart’s resistance levels: 1.3516 / 1.3589
H1 chart’s support levels: 1.3451 / 1.3388
Trading recommendations for today: Based on the H1 chart, buy (long) orders only if the GBP/USD pair breaks a bullish candlestick; the resistance level is at 1.3516, take profit is at 1.3589 and stop loss is at 1.3441.
The material has been provided by InstaForex Company – www.instaforex.com


