
Previous Story
Daily analysis of GBP/USD for January 11, 2018
Posted On 11 Jan 2018
Comment: 0
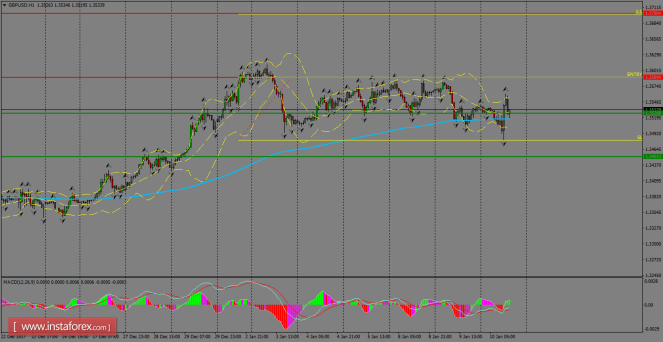
GBP/USD is hovering around the 200 SMA and remains well supported by the 200 SMA at the H1 chart. If a rebound happens around that area, the next target to the upside lies at 1.3589, where a breakout should open the doors to test the critical psychological level of 1.3700. To the downside, we cannot discard a pullback to test the support level of 1.3451.
H1 chart’s resistance levels: 1.3589 / 1.3700
H1 chart’s support levels: 1.3526 / 1.3451
Trading recommendations for today: Based on the H1 chart, buy (long) orders only if the GBP/USD pair breaks a bullish candlestick; the resistance level is at 1.3589, take profit is at 1.3700 and stop loss is at 1.3480.
The material has been provided by InstaForex Company – www.instaforex.com


