
Previous Story
Daily analysis of GBP/USD for May 08, 2018
Posted On 08 May 2018
Comment: 0
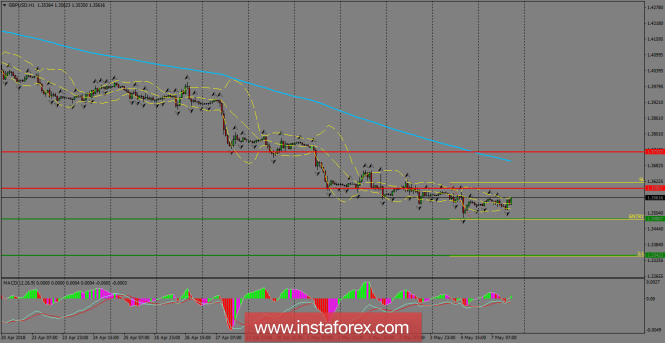
GBP/USD has been consolidating the price action below the resistance zone of 1.3595 and it can extend the bearish move below the 1.3480 level, where a breakout should open the doors to test the next target which lies at 1.3342. However, a corrective rebound could take place, but it should be capped by the 200 SMA at the H1 chart.
H1 chart’s resistance levels: 1.3595 / 1.3733
H1 chart’s support levels: 1.3480 / 1.3342
Trading recommendations for today: Based on the H1 chart, sell (short) orders only if the GBP/USD pair breaks a bullish candlestick; the resistance level is at 1.3480, take profit is at 1.3342, and stop loss is at 1.3618.The material has been provided by InstaForex Company – www.instaforex.com


