
Previous Story
Daily analysis of GBP/USD for May 14, 2018
Posted On 14 May 2018
Comment: 0
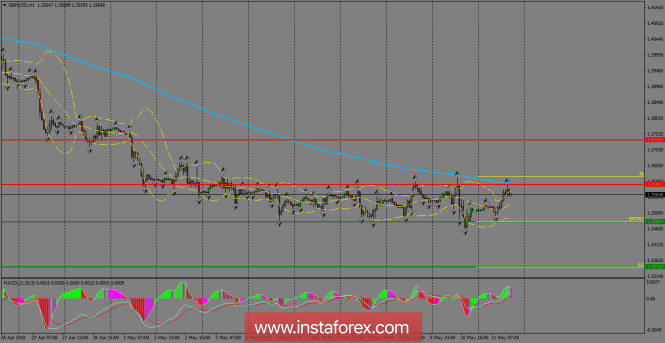
GBP/USD ended the last week within a range, established between the 1.3595 and 1.3733 levels and capped by the 200 SMA on the H1 chart. The overall picture remains bearish and the pair still targets the 1.3342 level as the next key barrier for the sellers. However, a break above the 200 SMA should expose the 1.3733 level. MACD indicator stays in favor of the bulls.
H1 chart’s resistance levels: 1.3595 / 1.3733
H1 chart’s support levels: 1.3480 / 1.3342
Trading recommendations for today: Based on the H1 chart, sell (short) orders only if the GBP/USD pair breaks a bullish candlestick; the resistance level is at 1.3480, take profit is at 1.3342, and stop loss is at 1.3618.The material has been provided by InstaForex Company – www.instaforex.com


