
Previous Story
Daily analysis of GBP/USD for April 24, 2017
Posted On 24 Apr 2017
Comment: 0
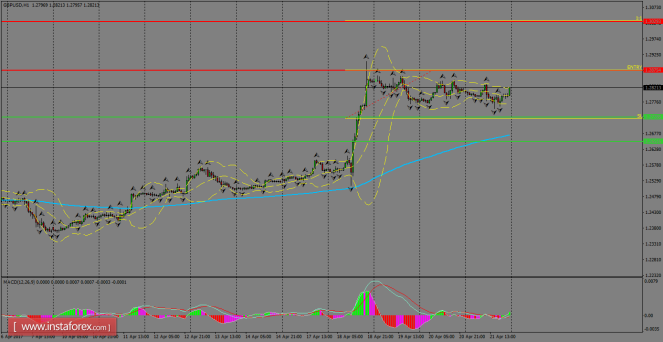
The pair is looking to break higher above 1.2875, as the bulls are
trying to gather enough bullish momentum in order to invalidate that
supply zone. However, GBP/USD has been in consolidation mode since
April 18th and eventually, we could witness some corrective moves
toward the 1.2728 level in a first degree. MACD indicator is turning
positive.
H1 chart’s resistance
levels: 1.2875 / 1.3029
H1 chart’s support levels:
1.2728 / 1.2652
Trading recommendations for today: Based on the H1 chart,
buy (long) orders only if the GBP/USD pair breaks a bullish
candlestick; the resistance level is at 1.2875, take profit is at
1.3029 and stop loss is at 1.2723.
The material has been provided by InstaForex Company – www.instaforex.com


