
Previous Story
Daily analysis of GBP/USD for August 01, 2017
Posted On 01 Aug 2017
Comment: 0
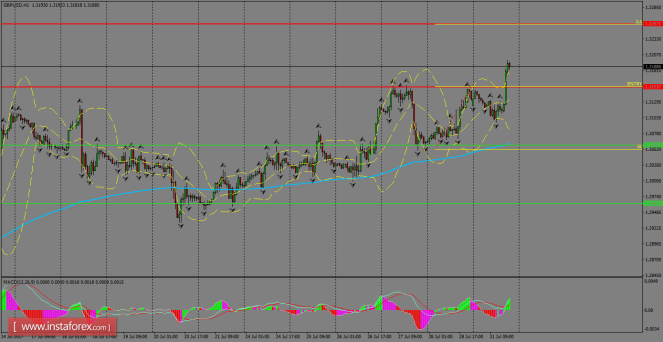
The pair is rallying and showing that bulls remain stronger across the board, with a breakout above the key level of 1.3153, which opens the door to test the next resistance around 1.3257. To the downside, we’re expecting a support to be found in the 200 SMA at H1 chart once GBP/USD breaks below 1.3153. MACD indicator still supports the bullish scenario.
H1 chart’s resistance levels: 1.3153 / 1.3257
H1 chart’s support levels: 1.3058 / 1.2962
Trading recommendations for today: Based on the H1 chart, buy (long) orders only if the GBP/USD pair breaks a bullish candlestick; the resistance level is at 1.3153, take profit is at 1.3257 and stop loss is at 1.3051.
The material has been provided by InstaForex Company – www.instaforex.com


