
Previous Story
Daily analysis of GBP/USD for August 15, 2017
Posted On 15 Aug 2017
Comment: 0
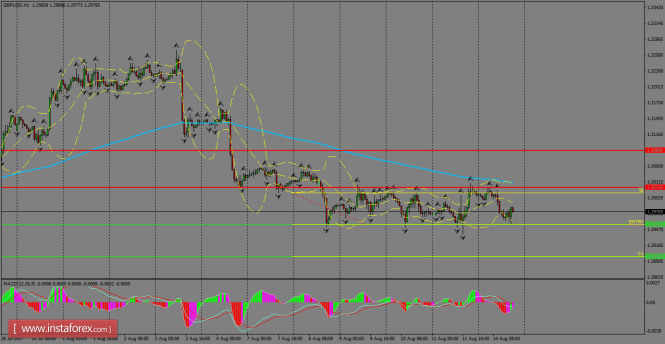
No major action was seen in the GBP/USD pair, which continues to be trapped in a narrow range established between the 1.3021 and 1.2955 levels. The 200 SMA at H1 chart still provides dynamic resistance and that could favor for more downside in the Cable. However, if the pair manages to break above 1.3021, we can expect a continuation towards 1.3080.
H1 chart’s resistance levels: 1.3021 / 1.3080
H1 chart’s support levels: 1.2955 / 1.2897
Trading recommendations for today: Based on the H1 chart, sell (short) orders only if the GBP/USD pair breaks a bearish candlestick; the support level is at 1.2955, take profit is at 1.2867 and stop loss is at 1.3011.
The material has been provided by InstaForex Company – www.instaforex.com


