
Previous Story
Daily analysis of GBP/USD for August 22, 2017
Posted On 22 Aug 2017
Comment: 0
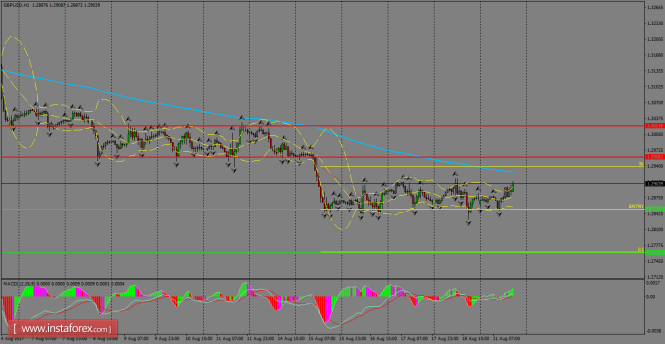
GBP/USD had a quiet start of the week and remains supported by the 1.2850 level. The 20 SMA at H1 chart is getting closer to the current price in the Cable and it could act as a dynamic resistance across the board. If it gives up, further gains are expected towards 1.2958 level. Above it, the next barrier is placed at the 1.3021 level.
H1 chart’s resistance levels: 1.2958 / 1.3021
H1 chart’s support levels: 1.2850 / 1.2761
Trading recommendations for today: Based on the H1 chart, place sell (short) orders only if the GBP/USD pair breaks a bearish candlestick; the support level is found at 1.2850, take profit lies at 1.2761 and stop loss is at 1.2938.
The material has been provided by InstaForex Company – www.instaforex.com


