
Previous Story
Daily analysis of GBP/USD for August 23, 2017
Posted On 23 Aug 2017
Comment: 0
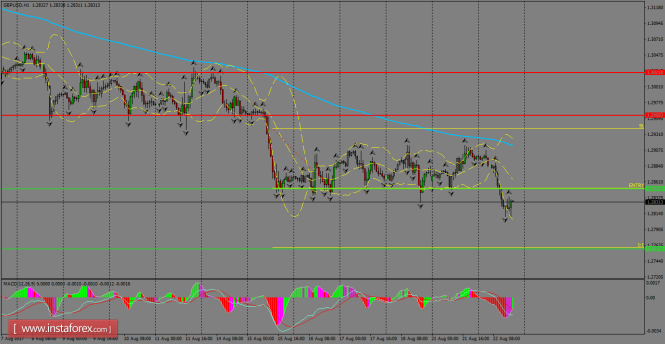
Volatility seen on Tuesday helped GBP/USD to test new lows and to break the narrow range in which has been trapped. If the bears keep pushing lower to the pair, we can expect a target around 1.2761, while a rebound can help to re-test August 21st highs or even the 200 SMA at H1 chart. MACD indicator remains in the negative territory, supporting the bearish idea.
H1 chart’s resistance levels: 1.2958 / 1.3021
H1 chart’s support levels: 1.2850 / 1.2761
Trading recommendations for today: Based on the H1 chart, sell (short) orders only if the GBP/USD pair breaks a bearish candlestick; the support level is at 1.2850, take profit is at 1.2761 and stop loss is at 1.2938.
The material has been provided by InstaForex Company – www.instaforex.com


