
Previous Story
Daily analysis of GBP/USD for December 01, 2017
Posted On 30 Nov 2017
Comment: 0
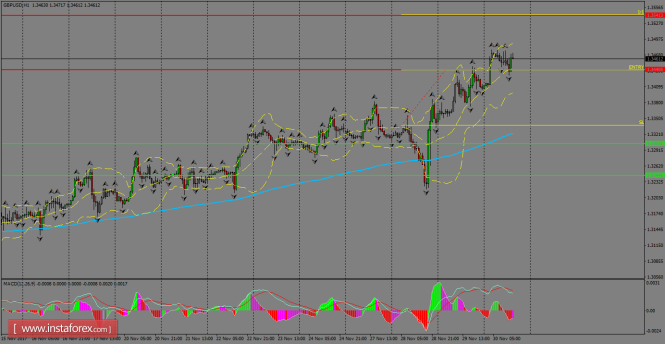
The pair remains following a bullish structure above the 200 SMA at H1 chart and looks forward to testing the 1.3541 level, amid USD weakness against the Pound. Corrective moves might happen in the short-term, with the nearest target placed around the 200 SMA and the 1.3303 level. MACD indicator remains in the negative territory, favoring to the downside.
H1 chart’s resistance levels: 1.3440 / 1.3541
H1 chart’s support levels: 1.3303 / 1.3244
Trading recommendations for today: Based on the H1 chart, buy (long) orders only if the GBP/USD pair breaks a bullish candlestick; the resistance level is at 1.3440, take profit is at 1.3541 and stop loss is at 1.3337.
The material has been provided by InstaForex Company – www.instaforex.com


