
Previous Story
Daily analysis of GBP/USD for June 12, 2017
Posted On 12 Jun 2017
Comment: 0
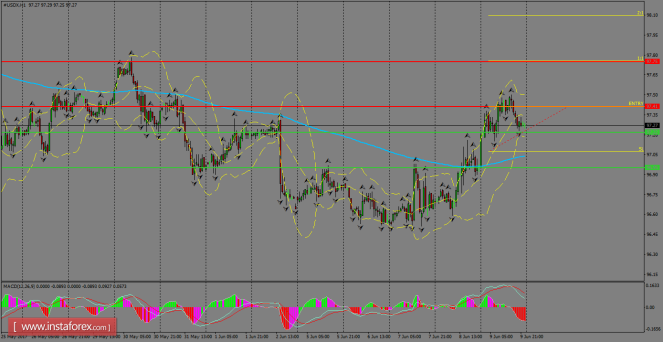
USDX managed to end last week with some considerable gains above the 200 SMA which is seen on the H1 chart. Now we focus on the 97.75 level, with the bulls gathering momentum at the current higher high pattern’s formation. To achieve that, the index should break the 97.41 level, while a pullback should send it to test the 96.95 level.
H1 chart’s resistance levels: 97.41 / 97.75
H1 chart’s support levels: 97.22 / 96.95
Trading recommendations for today: Based on the H1 chart, place buy (long) orders only if the USD Index breaks with a bullish candlestick; the resistance level is at 97.41, take profit is found at 97.75 and stop loss lies at 97.07.
The material has been provided by InstaForex Company – www.instaforex.com


