
Previous Story
Daily analysis of GBP/USD for June 27, 2017
Posted On 27 Jun 2017
Comment: 0
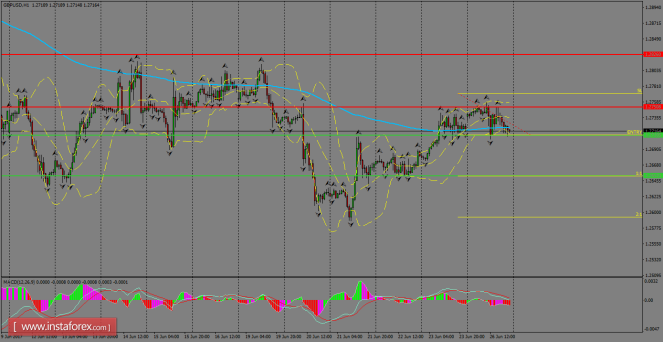
GBP/USD remains hovering around the 200 SMA area at H1 chart, with another attempt to break higher in order to extend the rally towards the next key resistance level of 1.2826. If the pair manages to break below 1.2710, then we can expect further weakness towards the support level of 1.2652. MACD indicator is still at the negative territory, favoring the bearish bias.
H1 chart’s resistance levels: 1.2750 / 1.2826
H1 chart’s support levels: 1.2710 / 1.2652
Trading recommendations for today: Based on the H1 chart, sell (short) orders only if the GBP/USD pair breaks a bearish candlestick; the support level is at 1.2710, take profit is at 1.2652 and stop loss is at 1.2770.
The material has been provided by InstaForex Company – www.instaforex.com


