
Previous Story
Daily analysis of GBP/USD for November 14, 2017
Posted On 13 Nov 2017
Comment: 0
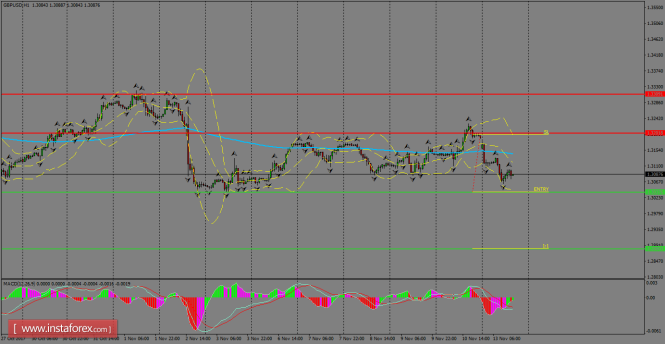
GBP/USD started the week with a bearish tone in the short-term, consolidating its price action below the 200 SMA at H1 chart and it seems we can see a testing of the support level at 1.3037. If that zone gives up, then another leg lower is possible, targeting the next barrier for sellers at 1.2880. MACD indicator is turning neutral, calling for further sideways’ moves.
H1 chart’s resistance levels: 1.3201 / 1.3309
H1 chart’s support levels: 1.3037 / 1.2880
Trading recommendations for today: Based on the H1 chart, sell (short) orders only if the GBP/USD pair breaks a bearish candlestick; the support level is at 1.3037, take profit is at 1.2880 and stop loss is at 1.3193.
The material has been provided by InstaForex Company – www.instaforex.com


