
Previous Story
Daily analysis of GBP/USD for November 16, 2017
Posted On 15 Nov 2017
Comment: 0
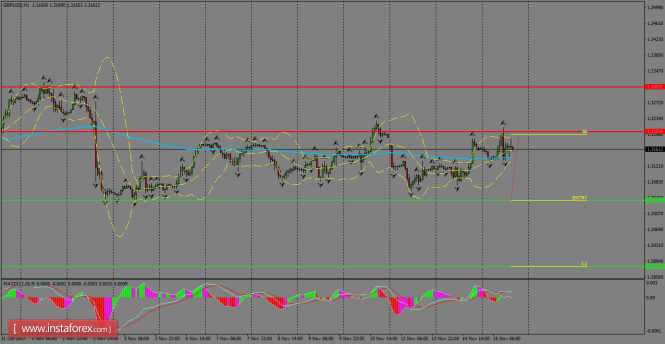
GBP/USD remains capped by the resistance level of 1.3201, waiting for a catalyst that helps do a decisive move in coming hours or days. The 200 SMA at the H1 chart is acting as a dynamic support across the board, but thanks to the bearish price action, we can expect a leg lower below that moving average, towards the support zone of 1.3037.
H1 chart’s resistance levels: 1.3201 / 1.3309
H1 chart’s support levels: 1.3037 / 1.2880
Trading recommendations for today: Based on the H1 chart, sell (short) orders only if the GBP/USD pair breaks a bearish candlestick; the support level is at 1.3037, take profit is at 1.2880 and stop loss is at 1.3193.
The material has been provided by InstaForex Company – www.instaforex.com


