
Previous Story
Daily analysis of GBP/USD for November 17, 2017
Posted On 17 Nov 2017
Comment: 0
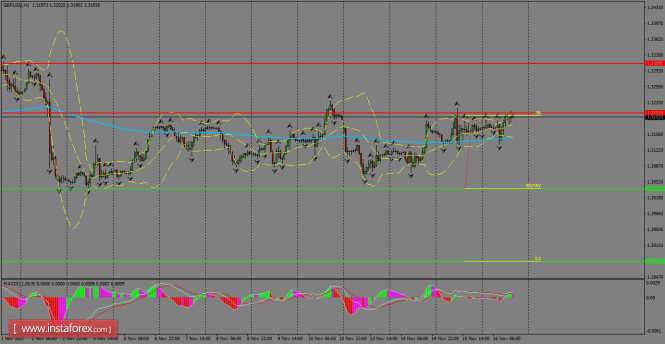
The pair is struggling to consolidate above the 200 SMA at the H1 chart, which remains as the dynamic support for the short-term, but bulls are not enough strong to push higher the GBP/USD pair. However, if it manages to break, a boost could happen towards the resistance zone of 1.3309. MACD indicator remains in the positive territory.
H1 chart’s resistance levels: 1.3201 / 1.3309
H1 chart’s support levels: 1.3037 / 1.2880
Trading recommendations for today: Based on the H1 chart, sell (short) orders only if the GBP/USD pair breaks a bearish candlestick; the support level is at 1.3037, take profit is at 1.2880 and stop loss is at 1.3193.
The material has been provided by InstaForex Company – www.instaforex.com


