
Previous Story
Daily analysis of S&P 500 for March 27, 2017
Posted On 27 Mar 2017
Comment: 0
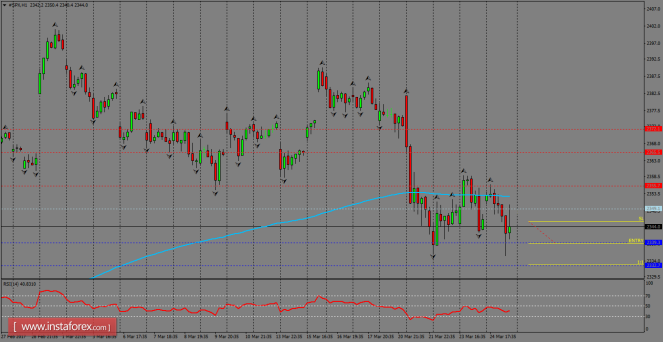
S&P 500 is consolidating its structure below the 200 SMA at H1 chart and the support zone of 2339.3 is now being challenged in the short-term. To witness further weakness, we should see first a breakout below that zone in order to reach the next key area around 2330. In the other side, if the index manages to break above 2335.7, it can rally towards 2365.5 in a first degree.
Trading recommendations for today: Based
on the H1 chart, place sell
(short)
orders only if the SP
500 breaks
a bearish candlestick;
the support
level is at 2339.3,
take profit is at 2332.7,
and stop loss is at 2345.4.
The material has been provided by InstaForex Company – www.instaforex.com


