
Previous Story
Daily analysis of USDX for April 06, 2017
Posted On 06 Apr 2017
Comment: 0
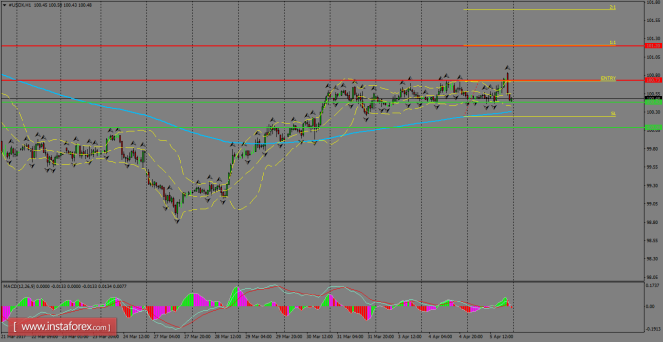
The index quickly erased Wednesday’s gains after FOMC minutes and
now it’s being supported by the 100.43 zone. However, the overall
picture remains bullish and if the US Dollar index succeeds to break
above 100.73, then it can test the 101.20 hurdle. By the other hand,
if USDX does a consolidation below the 200 SMA at H1 chart, then the
next target would be the 100.00 handle.
H1 chart’s resistance
levels: 100.73 / 101.20
H1 chart’s support levels:
100.43 / 100.08
Trading recommendations for today:
Based on the H1 chart, place
buy (long)
orders only if the USD Index
breaks with
a bullish
candlestick;
the resistance
level is at
100.73,
take profit is at
101.20
and stop loss is at 100.24.
The material has been provided by InstaForex Company – www.instaforex.com


