
Previous Story
Daily analysis of USDX for December 05, 2017
Posted On 04 Dec 2017
Comment: 0
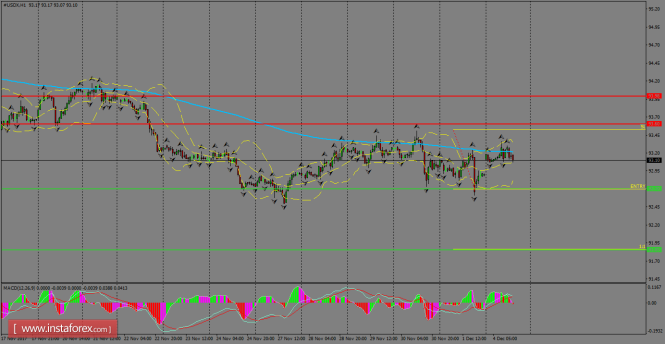
The index still consolidates its price action slightly below the 200 SMA at H1 chart. The next resistance ahead of that moving average lies at 93.60, at which a breakout should open the doors for more gains across the board, while to the downside, the critical level of 92.70 should help to keep bears under control.
H1 chart’s resistance levels: 93.60 / 93.98
H1 chart’s support levels: 92.70 / 91.85
Trading recommendations for today: Based on the H1 chart, place sell (short) orders only if the USD Index breaks with a bearish candlestick; the support level is at 92.70, take profit is at 91.85 and stop loss is at 93.53.
The material has been provided by InstaForex Company – www.instaforex.com


