
Previous Story
Daily analysis of USDX for February 07, 2018
Posted On 06 Feb 2018
Comment: 0
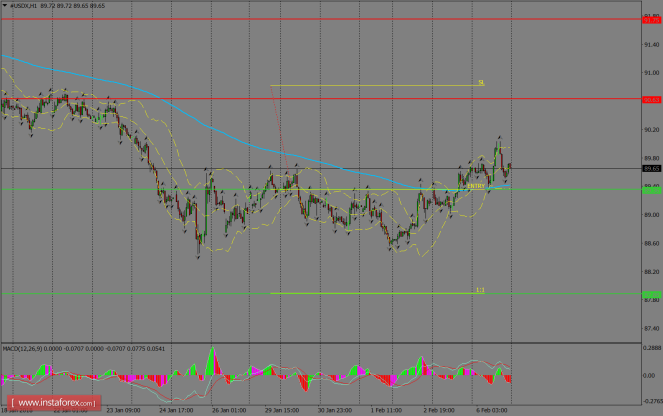
USDX still hovers around the 200 SMA at the H1 chart and it seems we could expect another leg higher. However, as the broad-based USD weakness remains alive across the board, one should expect a breakout of the 89.36 level in order to reach the support zone of 87.88. MACD indicator remains in the negative territory, supporting the bearish bias.
H1 chart’s resistance levels: 90.63 / 91.75
H1 chart’s support levels: 89.36 / 87.88
Trading recommendations for today: Based on the H1 chart, place sell (short) orders only if the USD Index breaks with a bearish candlestick; the support level is at 89.36, take profit is at 87.88 and stop loss is at 90.81.
The material has been provided by InstaForex Company – www.instaforex.com


