
Previous Story
Daily analysis of USDX for February 14, 2018
Posted On 14 Feb 2018
Comment: 0
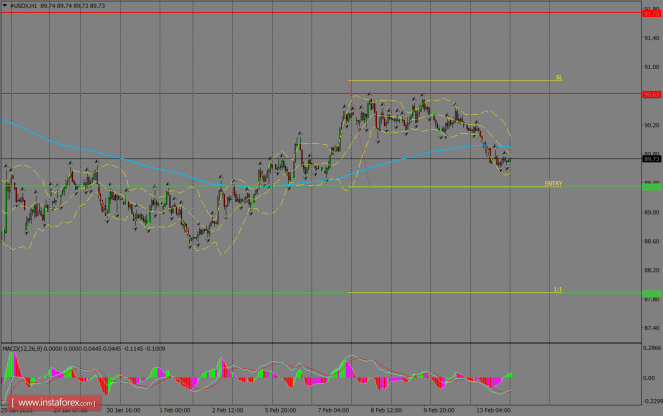
The index made a retracement below the 200 SMA at H1 chart, looking to test the support zone of 89.36. A break below that area will expose the 87.88 level as the next key area for the bulls. To the upside, the critical resistance still lies at 90.63, at which the US Dollar could gain momentum in order to resume the bullish bias.
H1 chart’s resistance levels: 90.63 / 91.75
H1 chart’s support levels: 89.36 / 87.88
Trading recommendations for today: Based on the H1 chart, place sell (short) orders only if the USD Index breaks with a bearish candlestick; the support level is at 89.36, take profit is at 87.88, and stop loss is at 90.81.
The material has been provided by InstaForex Company – www.instaforex.com


