
Previous Story
Daily analysis of USDX for February 22, 2017
Posted On 22 Feb 2017
Comment: 0
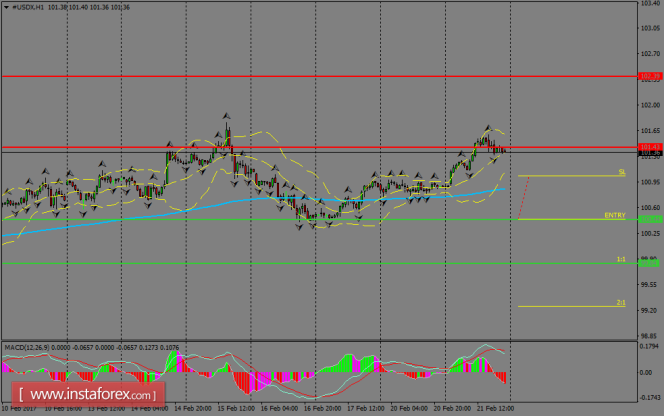
The index is struggling to break the resistance zone of 101.43, despite it had a very bullish session during Tuesday. If USDX manages to consolidate above that barrier, it’s highly expected to see a rally toward 102.39. However, if the index does a pullback at the current stage, then we can expect further declines to strengthen the bearish trend.
H1 chart’s resistance levels: 101.43 / 102.38
H1 chart’s support levels: 100.44 / 99.84
Trading recommendations for today: Based on the H1 chart, place sell (short) orders only if the USD Index breaks with a bearish candlestick; the support level is at 100.44, take profit is at 99.84 and stop loss is at 101.06.
The material has been provided by InstaForex Company – www.instaforex.com


