
Previous Story
Daily analysis of USDX for February 28, 2017
Posted On 28 Feb 2017
Comment: 0
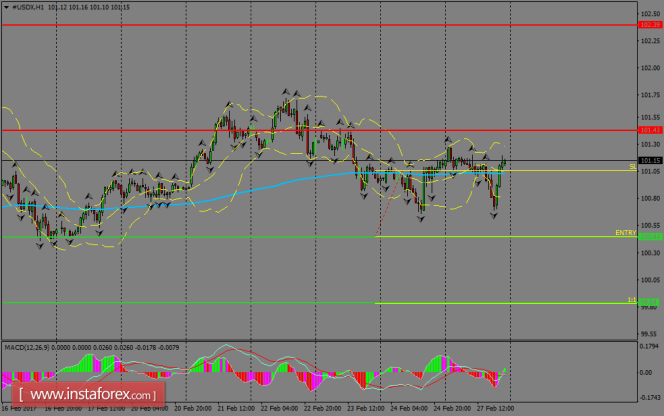
The index is looking for a clear path in the short-term, as we’re still seeing a sideways range well established around the 200 SMA zone at H1 chart. The support level of 100.44 is still of our interest to the downside, as it’s the latest hurdle to reach the 99.84 level and it could deliver more USD broad weakness for the coming days. MACD indicator is supporting further slight corrective moves to the upside.
H1 chart’s resistance levels: 101.43 / 102.38
H1 chart’s support levels: 100.44 / 99.84
Trading recommendations for today: Based on the H1 chart, place sell (short) orders only if the USD Index breaks with a bearish candlestick; the support level is at 100.44, take profit is at 99.84 and stop loss is at 101.06.
The material has been provided by InstaForex Company – www.instaforex.com


